Fig. 11
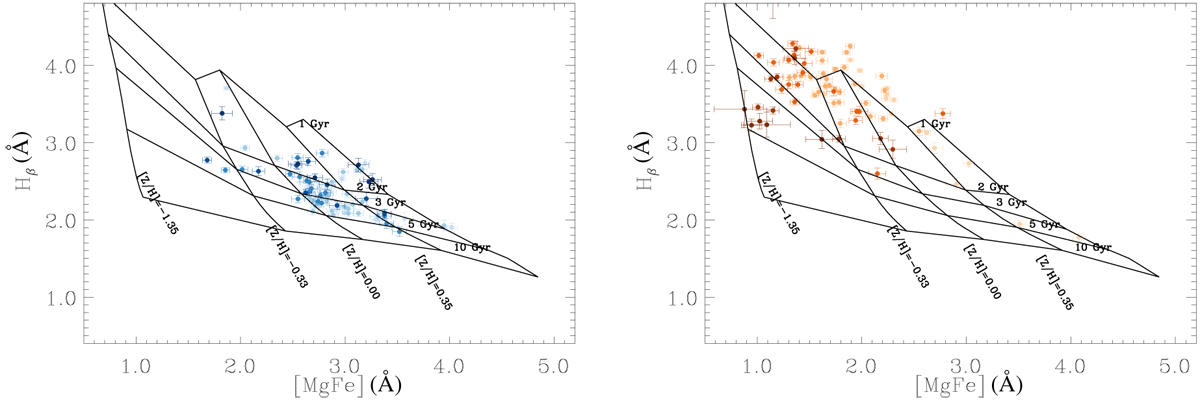
Lick indices for the main component (left panel, blue dots) and the secondary component (right panel, red dots). The color tonality indicates the position of the measurement with lighter colors for the central regions and darker colors for the external regions. The lines are the loci of constant age and metallicity as indicates by the labels.
Current usage metrics show cumulative count of Article Views (full-text article views including HTML views, PDF and ePub downloads, according to the available data) and Abstracts Views on Vision4Press platform.
Data correspond to usage on the plateform after 2015. The current usage metrics is available 48-96 hours after online publication and is updated daily on week days.
Initial download of the metrics may take a while.