Free Access
Fig. 1
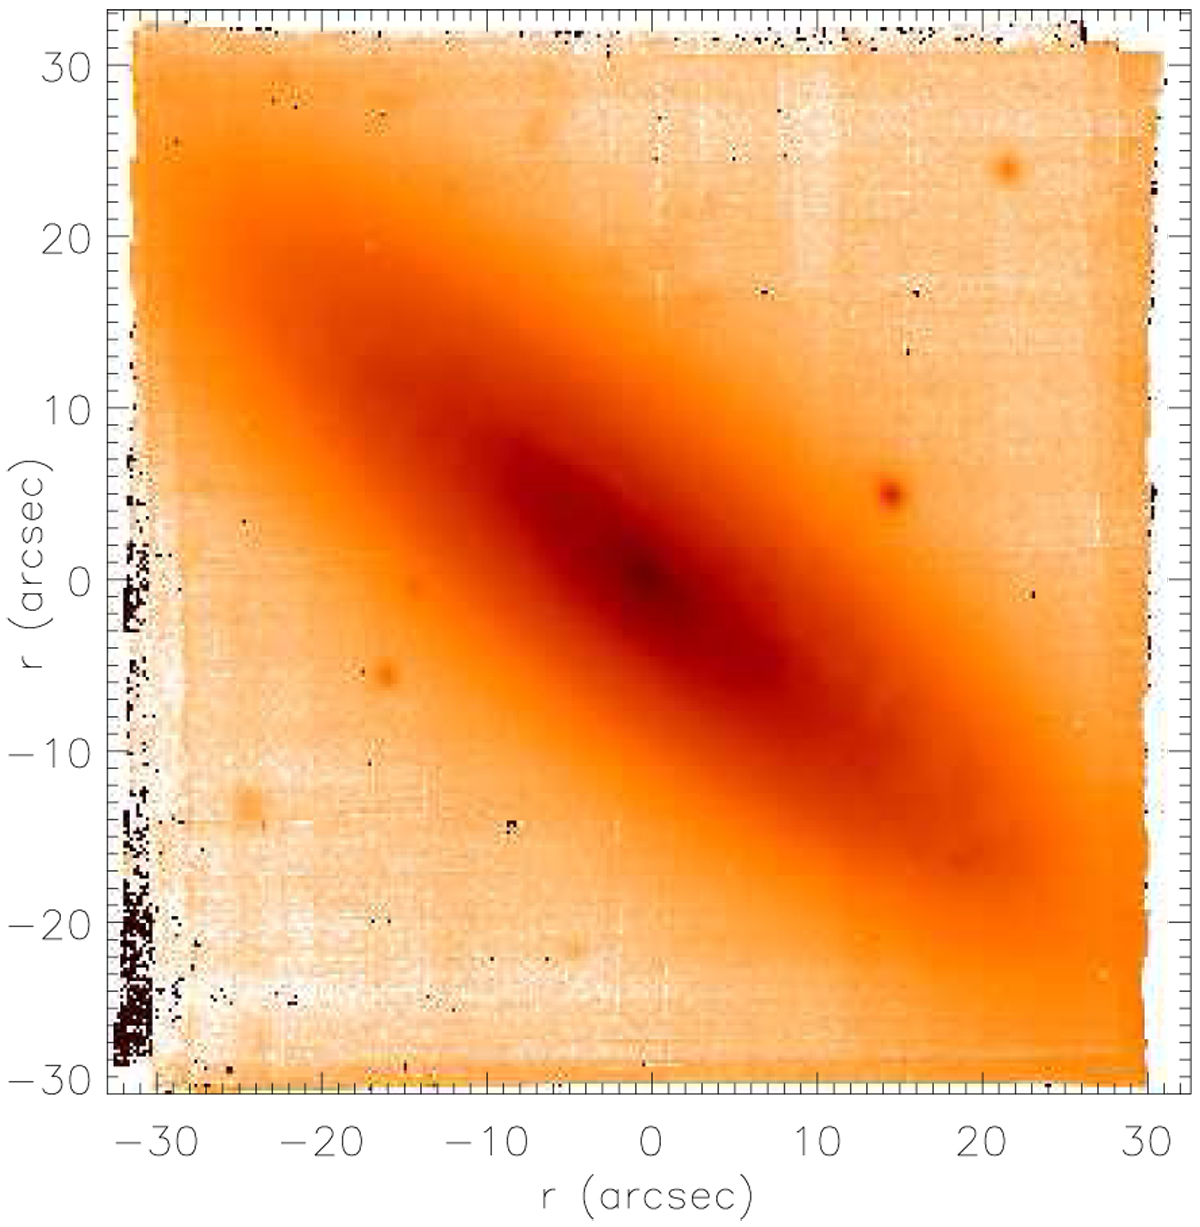
MUSE image of IC 719. The image was obtained by averaging the wavelength range 7500–8000 Å. The image intensity is shown with a logarithmic scale. The field of view and orientation of all 2D maps of the paper are ~ 1′ × 1′ and north up, east left.
Current usage metrics show cumulative count of Article Views (full-text article views including HTML views, PDF and ePub downloads, according to the available data) and Abstracts Views on Vision4Press platform.
Data correspond to usage on the plateform after 2015. The current usage metrics is available 48-96 hours after online publication and is updated daily on week days.
Initial download of the metrics may take a while.