Fig. 9
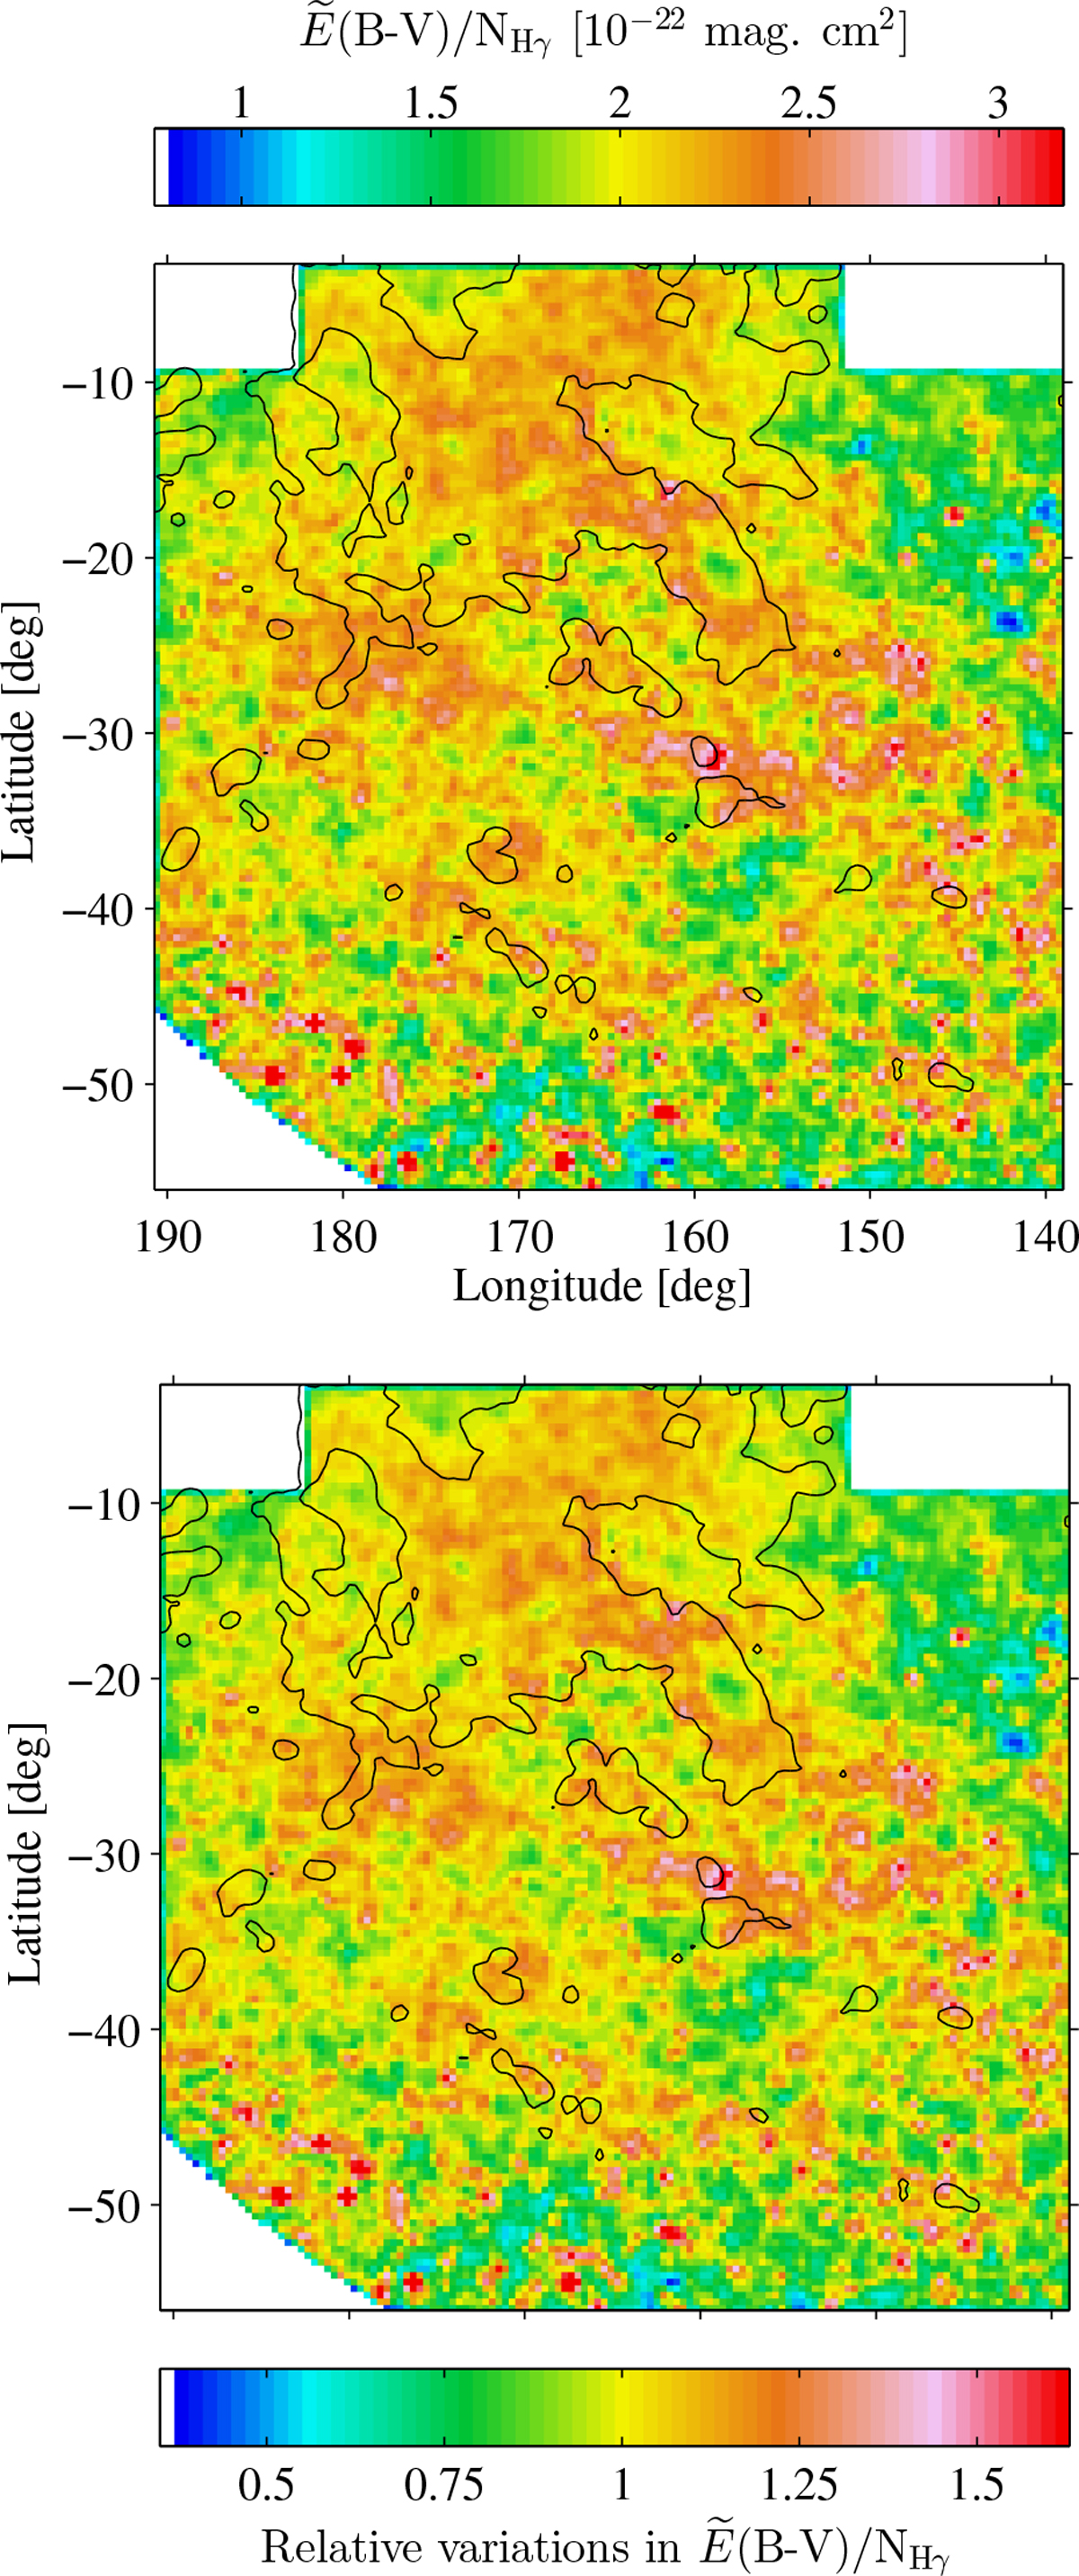
Spatial variations of the amount of reddening per gas nucleon, ![]() /NH γ, with the total gas measured by NH γ at 0. °375 resolution (top panel) and its variations relative to the average value of (2.02 ± 0.48) × 10−22 mag cm2 (bottom panel). Quantities with a tilde are convolved with the LAT response for an interstellar spectrum. The black contours outline the shape of the CO clouds at the level of 1 K km s−1 in WCO intensity.
/NH γ, with the total gas measured by NH γ at 0. °375 resolution (top panel) and its variations relative to the average value of (2.02 ± 0.48) × 10−22 mag cm2 (bottom panel). Quantities with a tilde are convolved with the LAT response for an interstellar spectrum. The black contours outline the shape of the CO clouds at the level of 1 K km s−1 in WCO intensity.
Current usage metrics show cumulative count of Article Views (full-text article views including HTML views, PDF and ePub downloads, according to the available data) and Abstracts Views on Vision4Press platform.
Data correspond to usage on the plateform after 2015. The current usage metrics is available 48-96 hours after online publication and is updated daily on week days.
Initial download of the metrics may take a while.