Fig. 6.
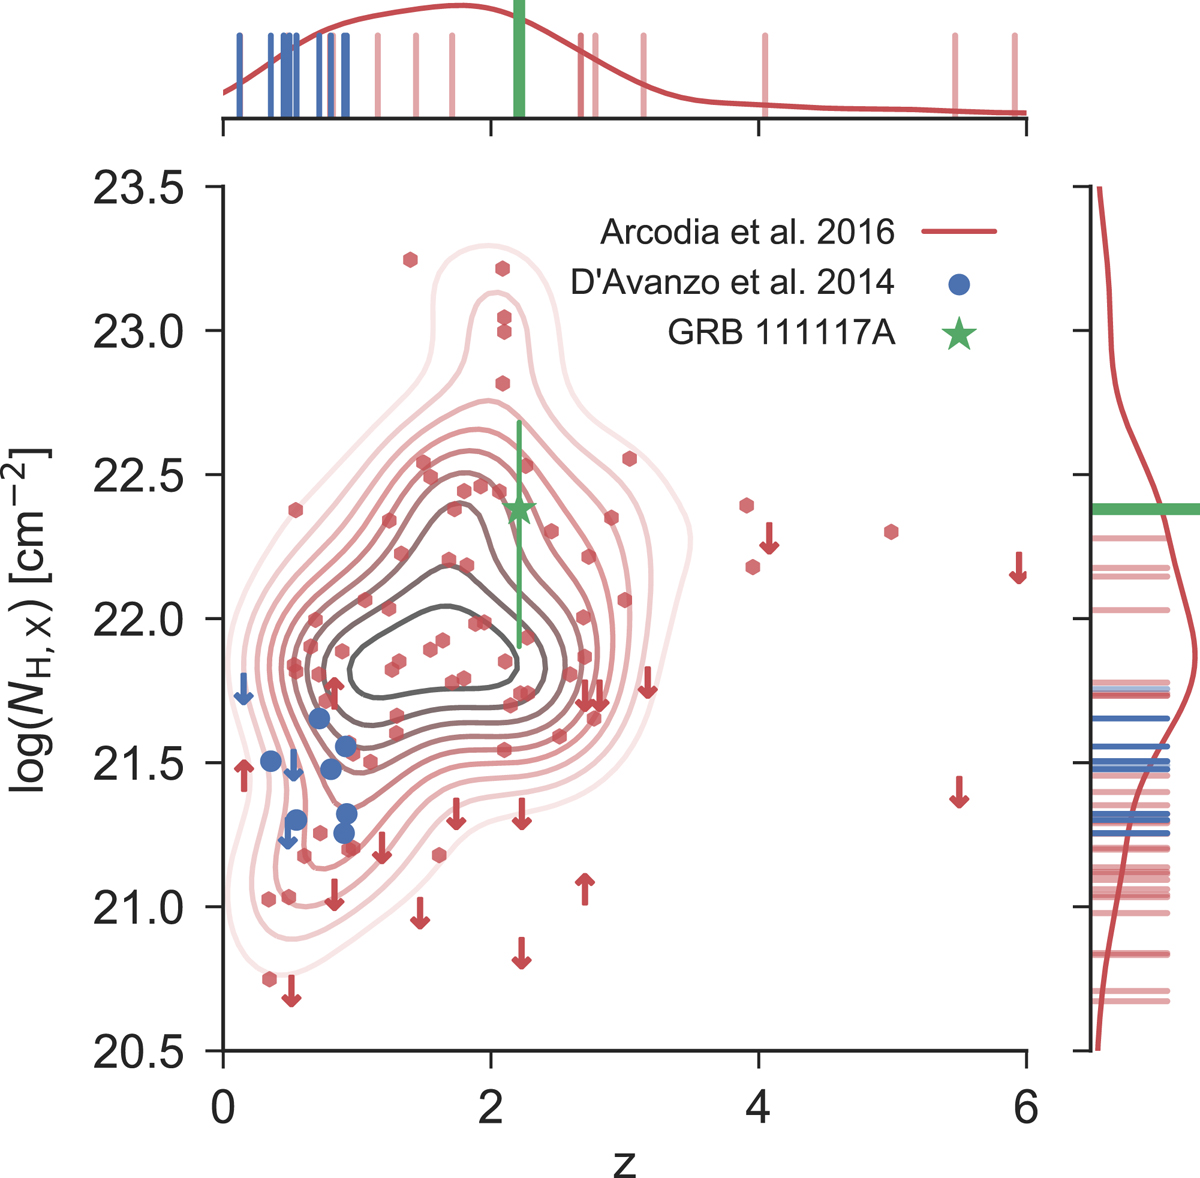
Rest frame, X-ray derived equivalent hydrogen column density of GRB 111117A compared to complete samples of both long and short populations of GRBs. The sample of lGRBs from Arcodia et al. (2016) is shown in red, where detections are also shown with a kernel density estimate of the points, and the limits on NH,X are shown with arrows. The complete sample of sGRB by D’Avanzo et al. (2014) is shown in blue, where again the limits are indicated by arrows. Marginalizations over both axes are shown on the right and at the top of the plot, where the limits are shown as semi-transparent bars and detections as solid ones. The red curves in the marginalization plots are again the kernel density estimates of the Arcodia et al. (2016) sample.
Current usage metrics show cumulative count of Article Views (full-text article views including HTML views, PDF and ePub downloads, according to the available data) and Abstracts Views on Vision4Press platform.
Data correspond to usage on the plateform after 2015. The current usage metrics is available 48-96 hours after online publication and is updated daily on week days.
Initial download of the metrics may take a while.