Fig. 5.
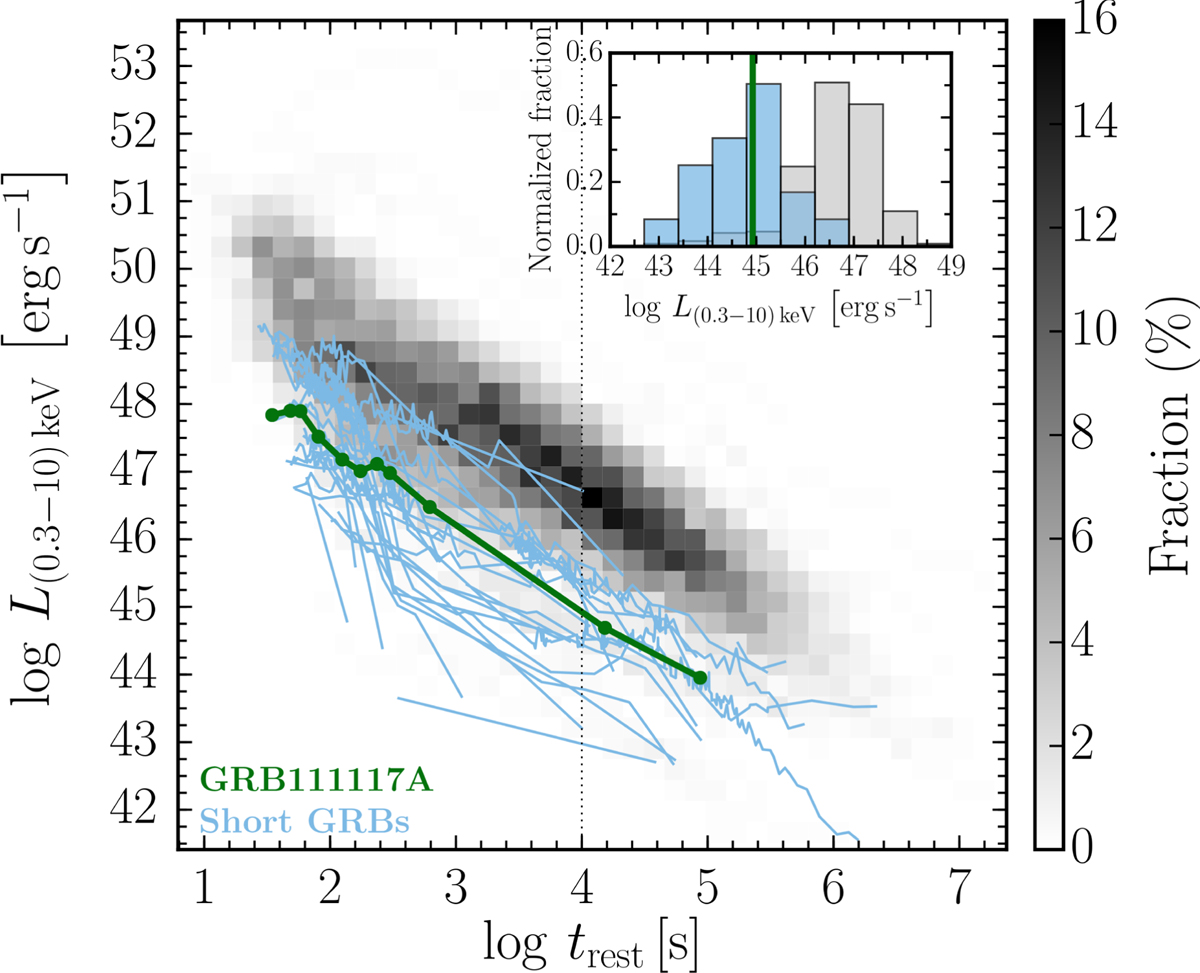
Rest-frame XRT light curve of GRB 111117A, compared to the general population of XRT light curves of GRBs. The gray shaded region is a compilation of long GRB light curves (Evans et al. 2007, 2009), where the color represents density. The light blue lines are sGRB light curves from bursts with duration of T90 ≲ 2 s and those that were classified as short in Kann et al. (2011), Berger (2014) and D’Avanzo et al. (2014). The thick green line is GRB 111117A. Despite the remarkably high redshift, the luminosity is comparable to the bulk of the short burst population, and subluminous compared to the lGRB population. The inset shows the X-ray luminosity distributions of sGRBs and lGRBs at 10 ks, indicated by the vertical dashed line in the main panel.
Current usage metrics show cumulative count of Article Views (full-text article views including HTML views, PDF and ePub downloads, according to the available data) and Abstracts Views on Vision4Press platform.
Data correspond to usage on the plateform after 2015. The current usage metrics is available 48-96 hours after online publication and is updated daily on week days.
Initial download of the metrics may take a while.