Fig. 3.
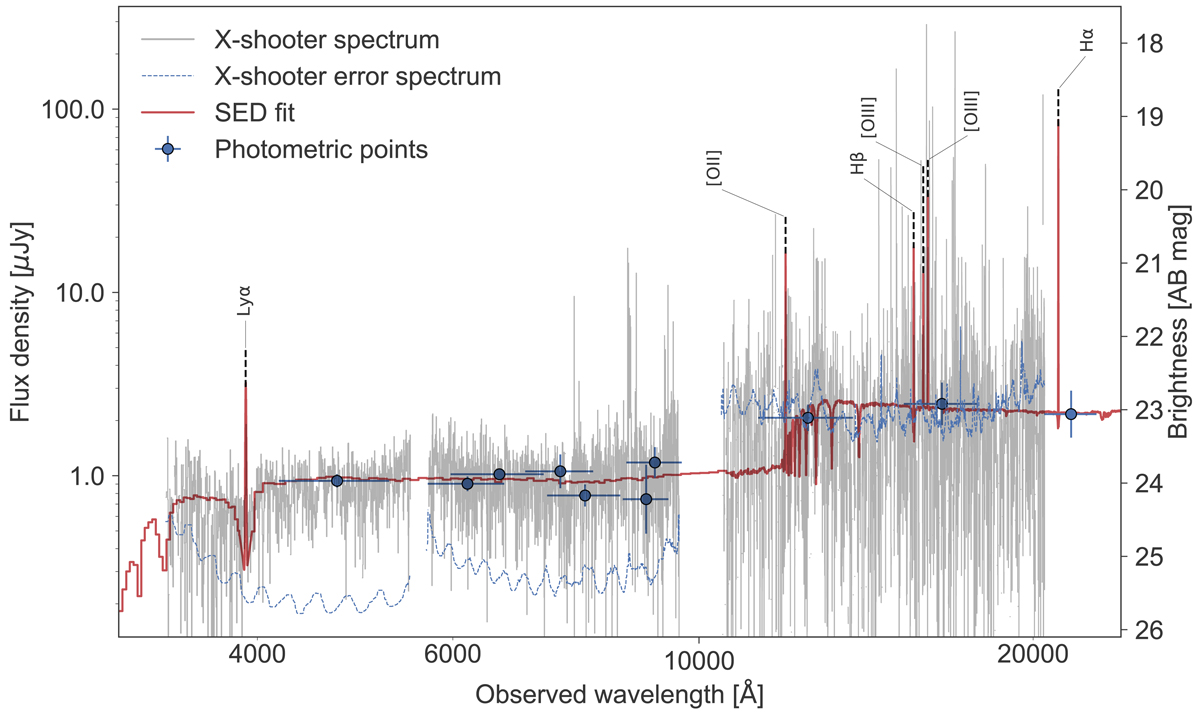
Best-fit SED to the derived photometry. The detection of Lyα is predicted from the SED fit and confirmed by the spectroscopic observations. Overplotted in gray is the observed spectrum, binned by 6 Å for presentation purposes. Slit losses have been corrected for based on the average seeing of the observations, as confirmed by the comparison with the photometry. The blue dashed curve is the corresponding error spectrum, smoothed for presentation purposes. The spectral gaps at 5500 Å and 10000 Å are due to the merging of the arms.
Current usage metrics show cumulative count of Article Views (full-text article views including HTML views, PDF and ePub downloads, according to the available data) and Abstracts Views on Vision4Press platform.
Data correspond to usage on the plateform after 2015. The current usage metrics is available 48-96 hours after online publication and is updated daily on week days.
Initial download of the metrics may take a while.