Fig. 2.
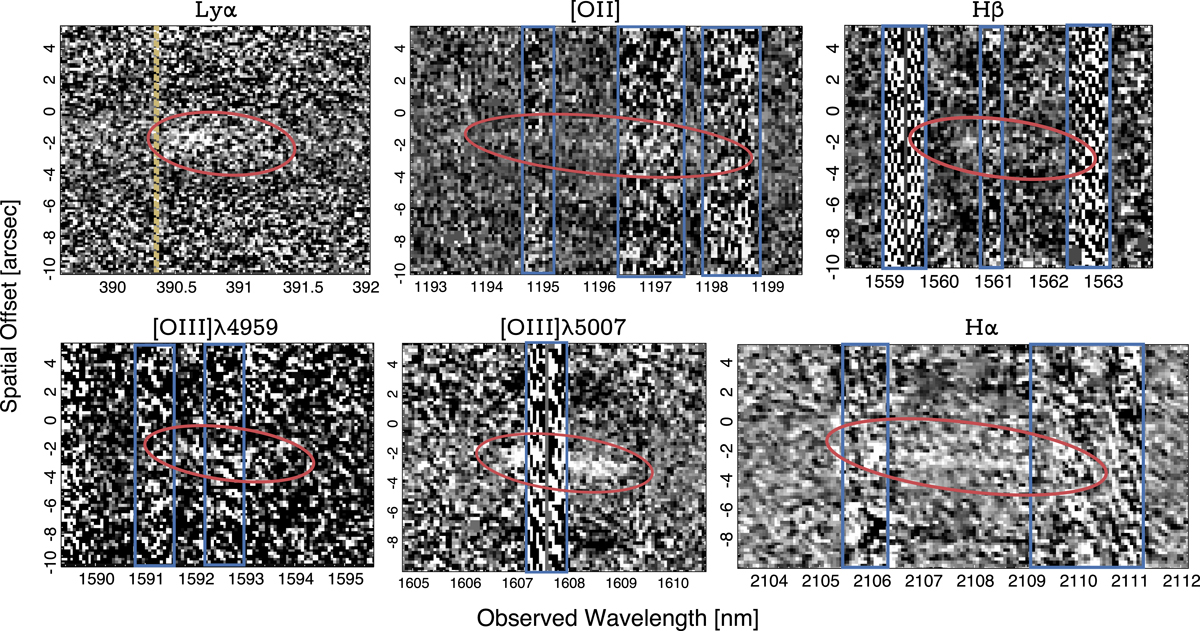
Two-dimensional images of the emission lines corresponding to Lyα, [O II]λ3727, Hβ, [O III]λ4959, [O III]λ5007, and Hα. The location of bright skylines are marked by blue boxes. The locations of the emission lines are indicated with red ellipses. Because the host is observed in nodding mode, negative images of the emission lines appear on both sides in the spatial direction. For the upper left panel containing Lyα, the systemic redshift position of Lyα is marked by a yellow vertical dashed line. The red part of the [O II]λ3727-doublet is affected by atmospheric absorption.
Current usage metrics show cumulative count of Article Views (full-text article views including HTML views, PDF and ePub downloads, according to the available data) and Abstracts Views on Vision4Press platform.
Data correspond to usage on the plateform after 2015. The current usage metrics is available 48-96 hours after online publication and is updated daily on week days.
Initial download of the metrics may take a while.