Fig. 8
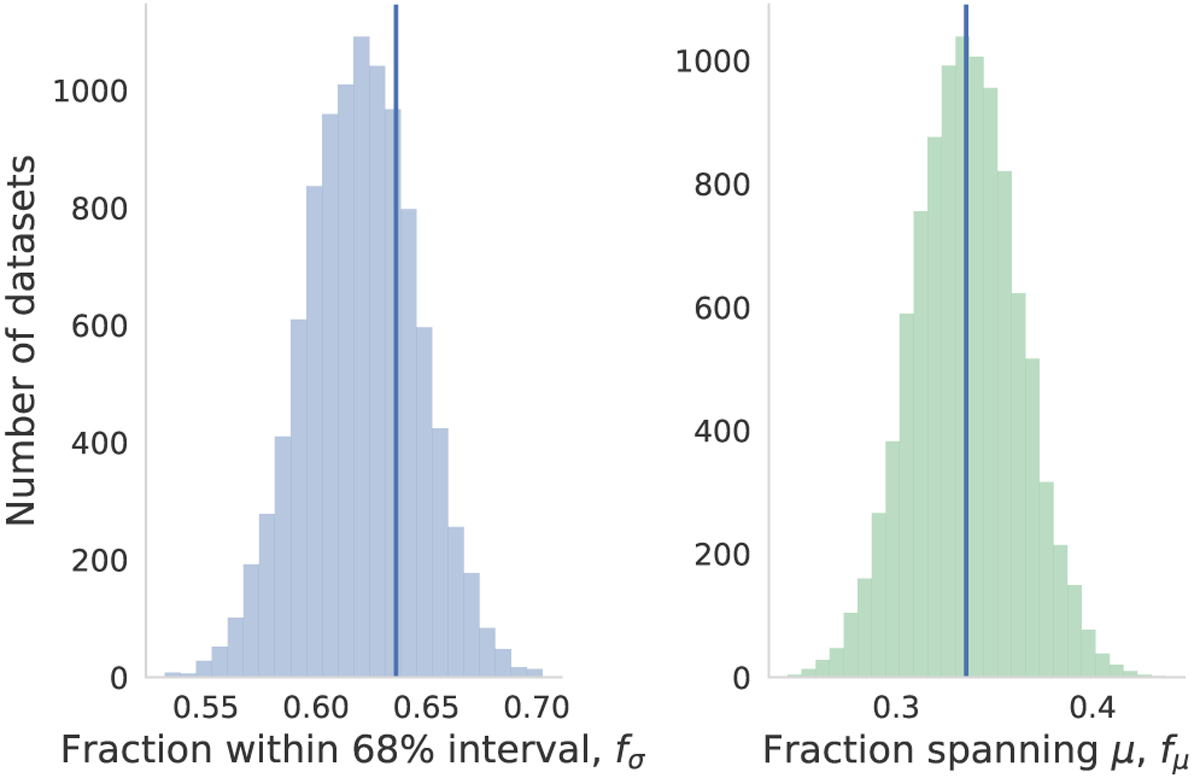
Distribution of f1σ (left) and fμ (right) for 10 000 generated datasets from the second level of our HBM (the true posteriors, see Eq. (16)). The comparison to the values for the real dataset is represented by the vertical line. The real data falls within the 73rd and 50th percentiles of the generated distributions for f1σ and fμ, respectively.
Current usage metrics show cumulative count of Article Views (full-text article views including HTML views, PDF and ePub downloads, according to the available data) and Abstracts Views on Vision4Press platform.
Data correspond to usage on the plateform after 2015. The current usage metrics is available 48-96 hours after online publication and is updated daily on week days.
Initial download of the metrics may take a while.