Fig. 6
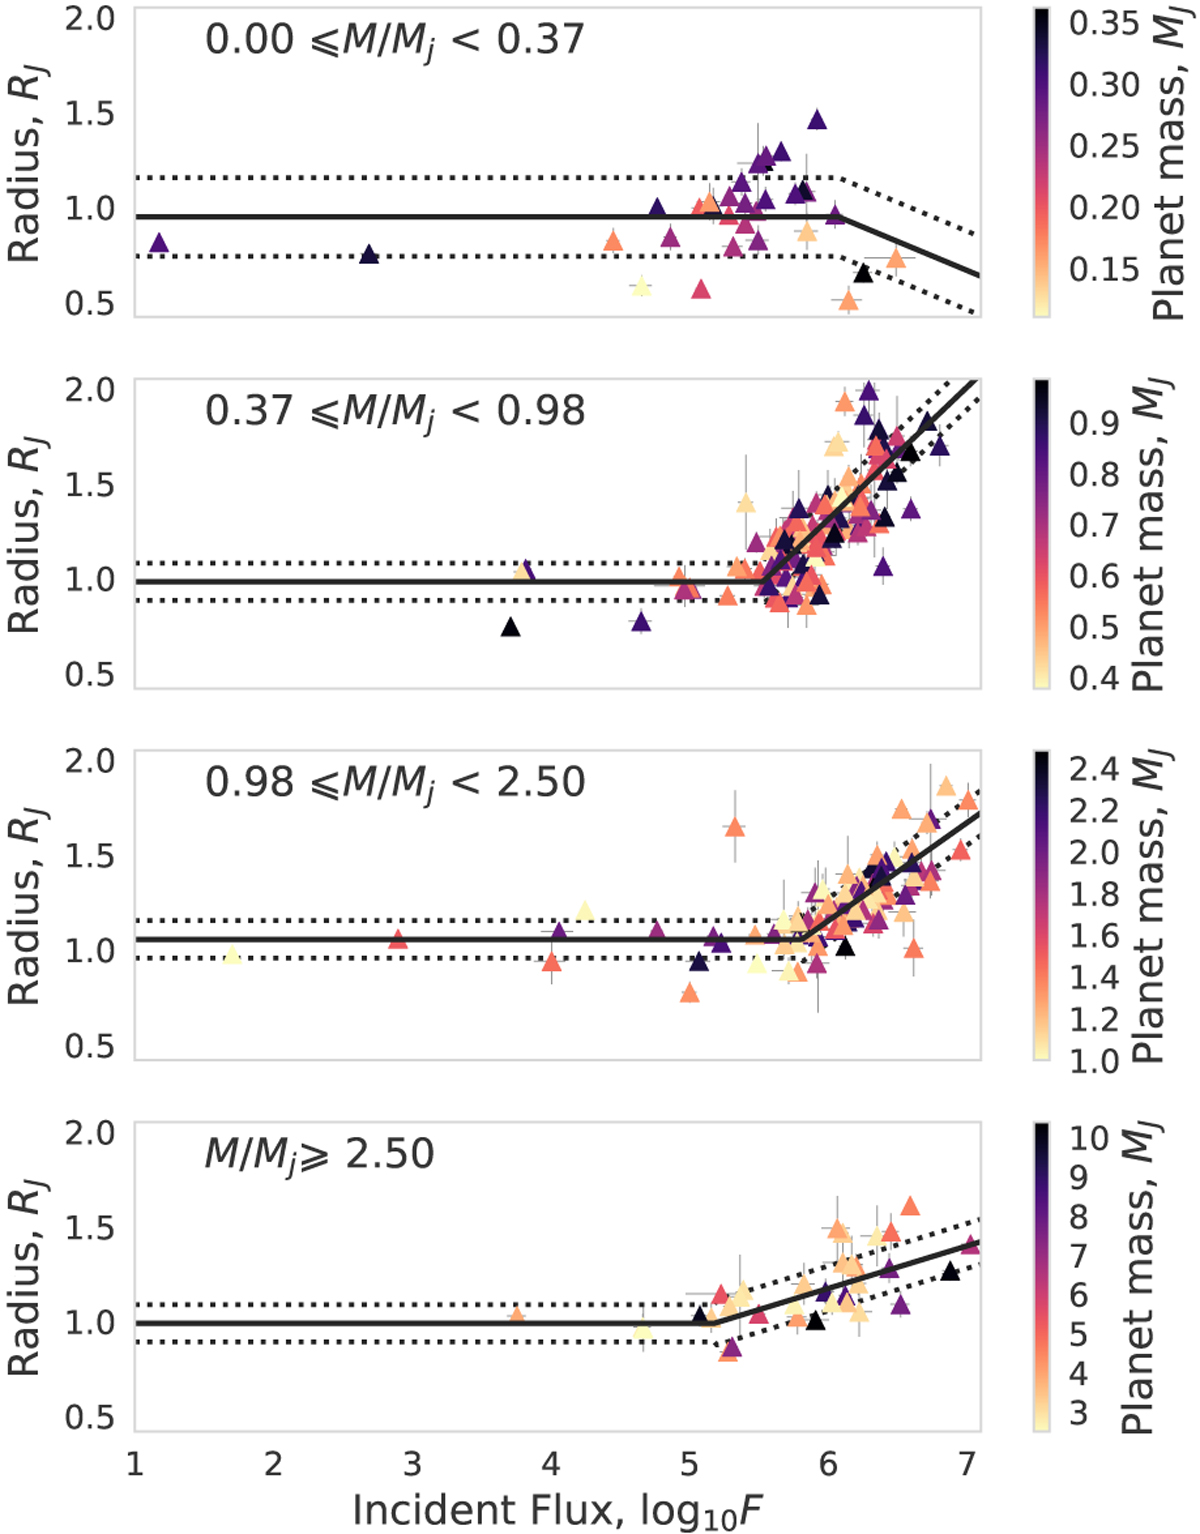
Relations of our model plotted for parameters set at their best-fit values. The solid line is
μR (F, M), and the dotted lines are μR(F, M) ± σR(F, M); in the best-fit model, 68% of true values of the planets should lie within. The points represent the data values of the planet parameters of our sample
![]() with observational uncertainty error bars.
with observational uncertainty error bars.
Current usage metrics show cumulative count of Article Views (full-text article views including HTML views, PDF and ePub downloads, according to the available data) and Abstracts Views on Vision4Press platform.
Data correspond to usage on the plateform after 2015. The current usage metrics is available 48-96 hours after online publication and is updated daily on week days.
Initial download of the metrics may take a while.