Free Access
Fig. 12
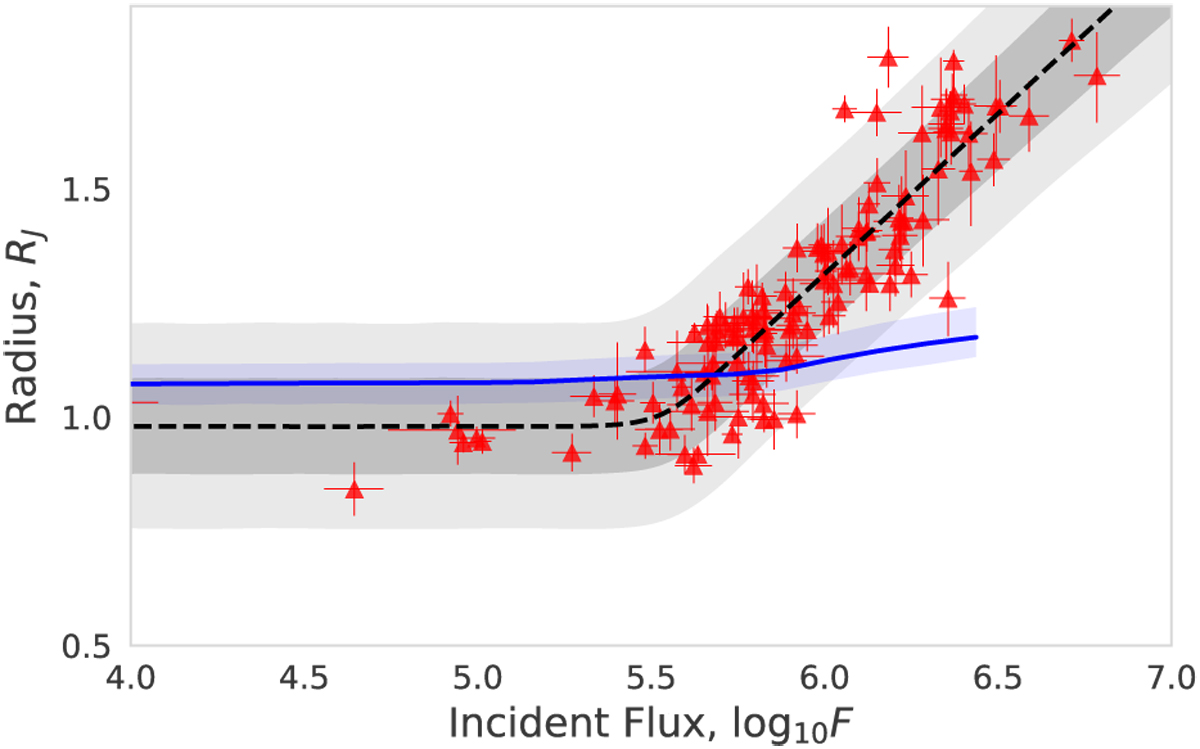
Our marginalised posterior radius-flux distribution for
![]() , with the central 68% interval shaded in dark grey, and the 95% interval in light grey. Plotted against a flux-radius relation
pM (R|F) predicted by a non-inflationary planet model, with the central 68% interval shaded in blue.
, with the central 68% interval shaded in dark grey, and the 95% interval in light grey. Plotted against a flux-radius relation
pM (R|F) predicted by a non-inflationary planet model, with the central 68% interval shaded in blue.
Current usage metrics show cumulative count of Article Views (full-text article views including HTML views, PDF and ePub downloads, according to the available data) and Abstracts Views on Vision4Press platform.
Data correspond to usage on the plateform after 2015. The current usage metrics is available 48-96 hours after online publication and is updated daily on week days.
Initial download of the metrics may take a while.