Fig. 10
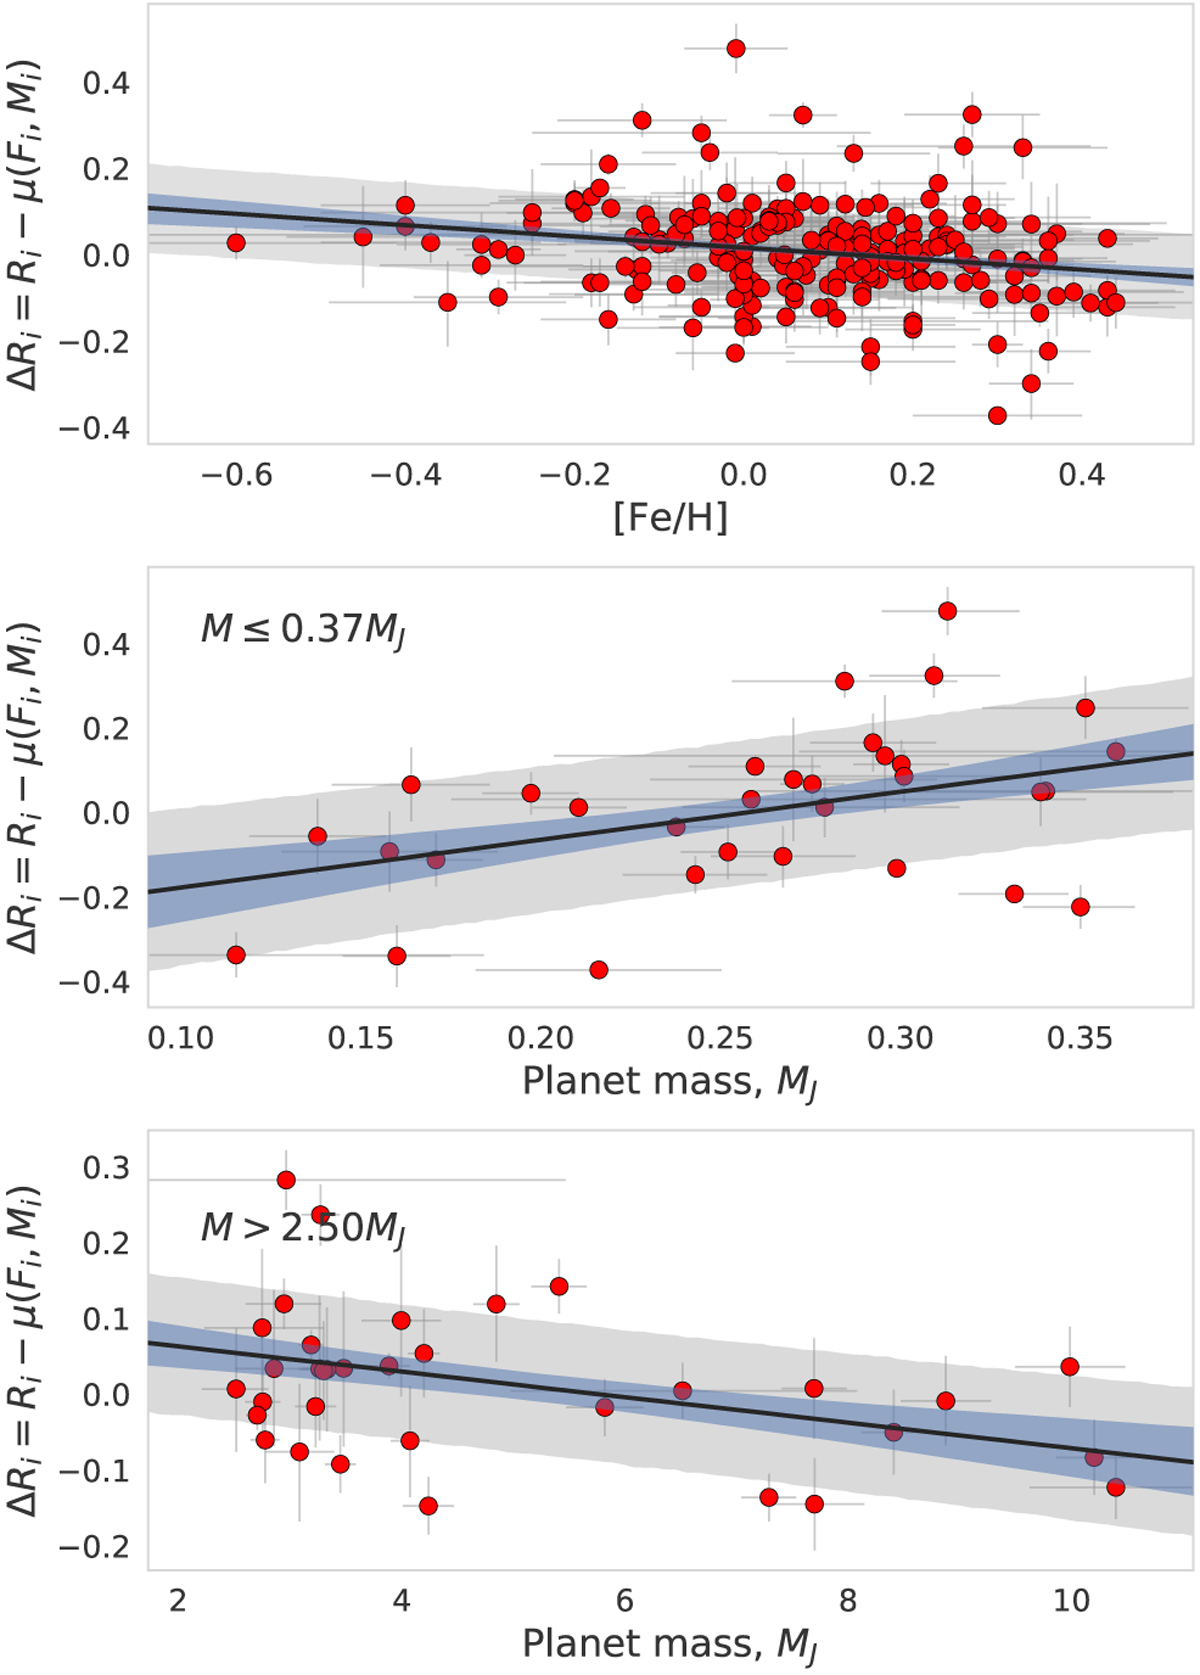
Radius residuals, ΔRi = Ri − μ(Fi, Mi), plotted against host star metallicity (top), and planet mass for the lowest mass bin (middle) and the highest mass bin (bottom). The shaded grey region is the marginalised 68% coverage interval of our linear regression, and the shaded blue region represents the 1σ limits of themean line.
Current usage metrics show cumulative count of Article Views (full-text article views including HTML views, PDF and ePub downloads, according to the available data) and Abstracts Views on Vision4Press platform.
Data correspond to usage on the plateform after 2015. The current usage metrics is available 48-96 hours after online publication and is updated daily on week days.
Initial download of the metrics may take a while.