Fig. 5
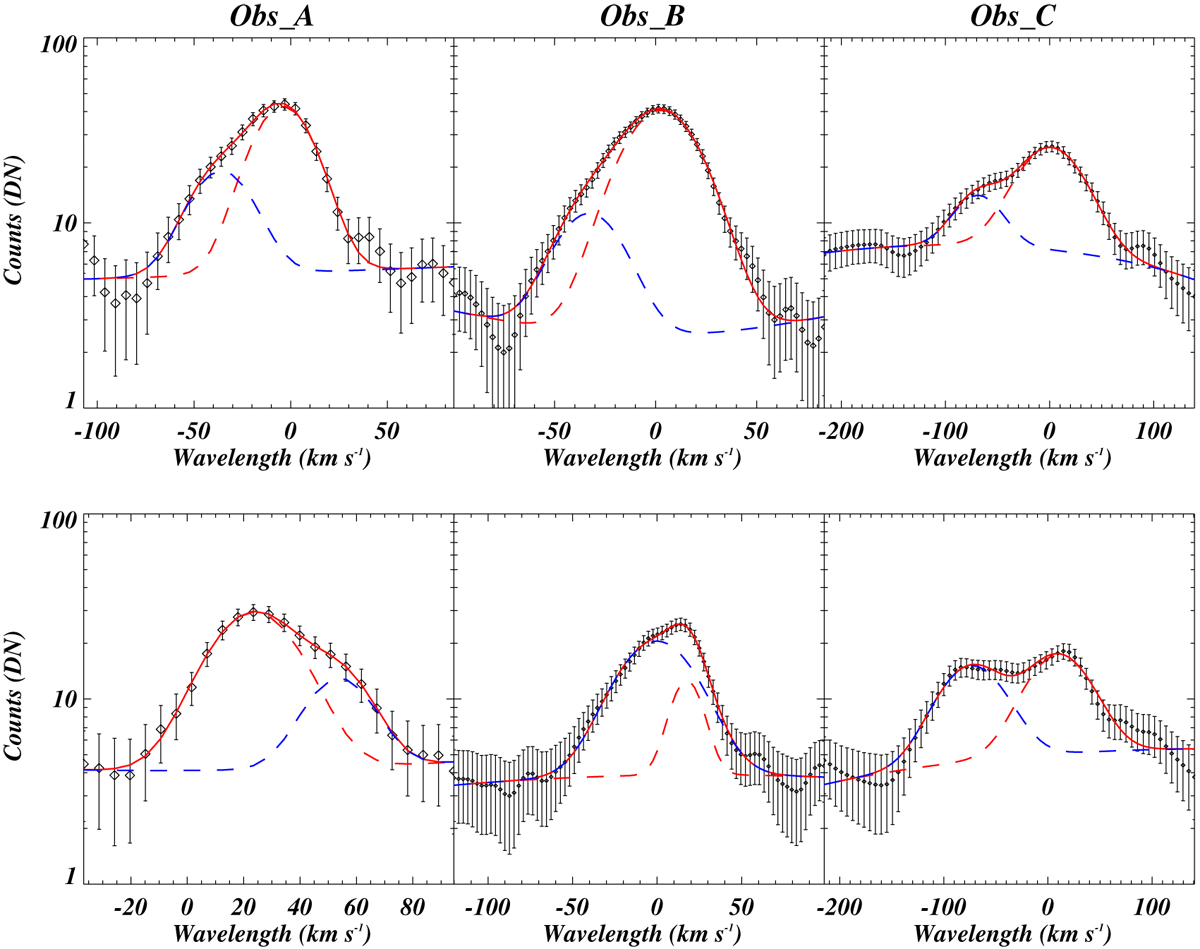
Sample spectral profiles and their fitting from Obs_A (left column), Obs_B (middle column), and Obs_ C (right column). The black diamonds show the observed profiles, while the solid red line represents the corresponding fitting. The red dashed line shows the main Gaussian, while the blue dashed line shows the secondary Gaussian. The double-Gaussian fitting leads to very reliable fits to the observed profiles.
Current usage metrics show cumulative count of Article Views (full-text article views including HTML views, PDF and ePub downloads, according to the available data) and Abstracts Views on Vision4Press platform.
Data correspond to usage on the plateform after 2015. The current usage metrics is available 48-96 hours after online publication and is updated daily on week days.
Initial download of the metrics may take a while.