Fig. 1
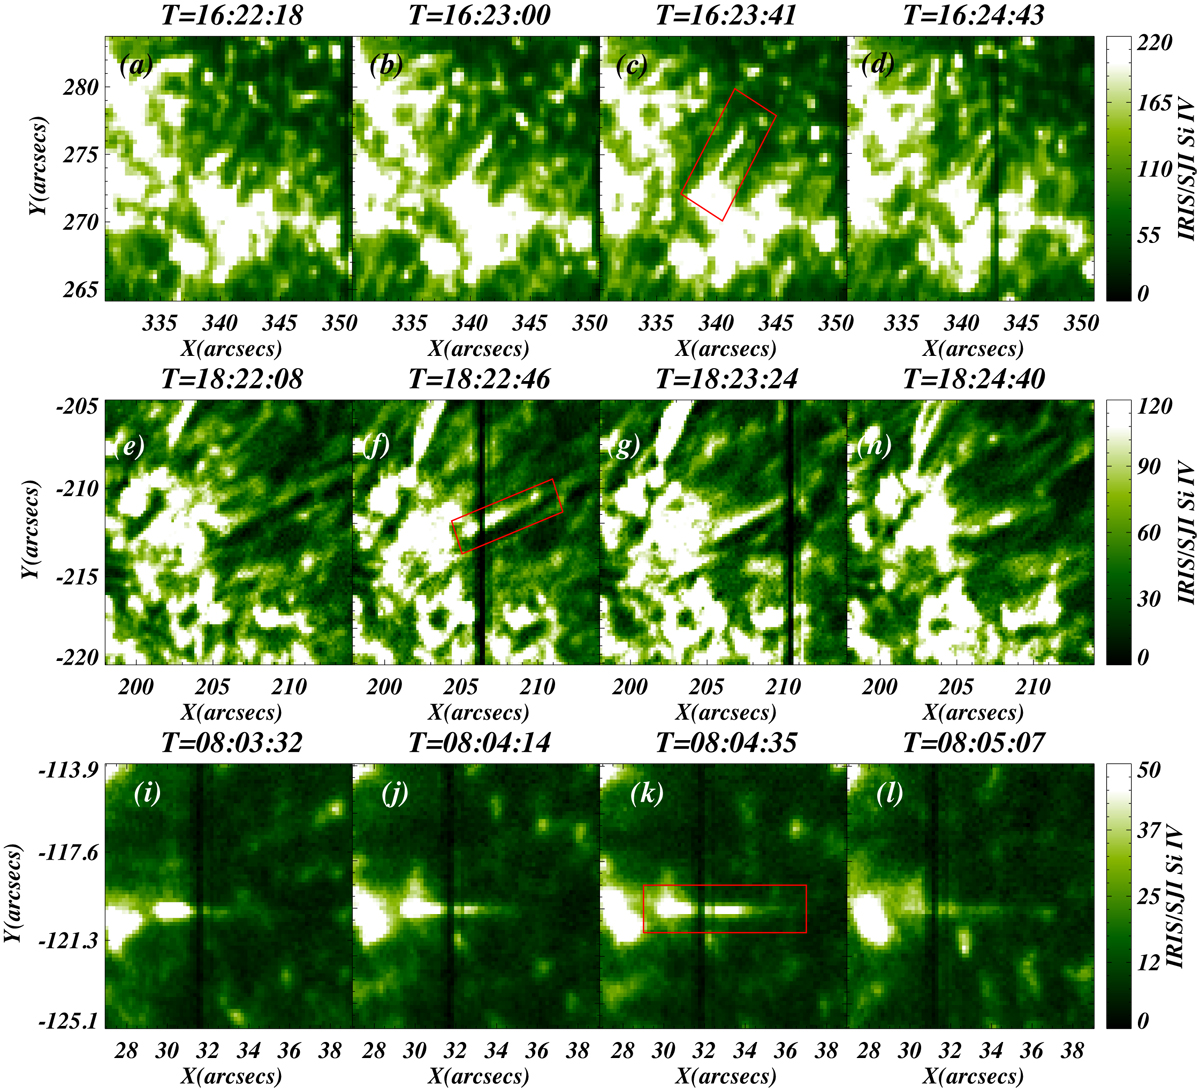
Top panels: evolution of a network jet taken from first observation (Obs_A). The jet originates at 16:22:18 UT on 14 December 2014 from the edge of the magnetic network (panel a) with its maximum phase around 16:23:41 UT (panel c; as outlined by the red rectangle). The jet fades from view in the last phase (panel d). Middle panels: evolution of another network jet taken from second observation (Obs_ B). The jet is shown by the red rectangle. Bottom panels: evolution of one more network jet which is taken from the third observation (Obs_C).
Current usage metrics show cumulative count of Article Views (full-text article views including HTML views, PDF and ePub downloads, according to the available data) and Abstracts Views on Vision4Press platform.
Data correspond to usage on the plateform after 2015. The current usage metrics is available 48-96 hours after online publication and is updated daily on week days.
Initial download of the metrics may take a while.