Fig. 3.
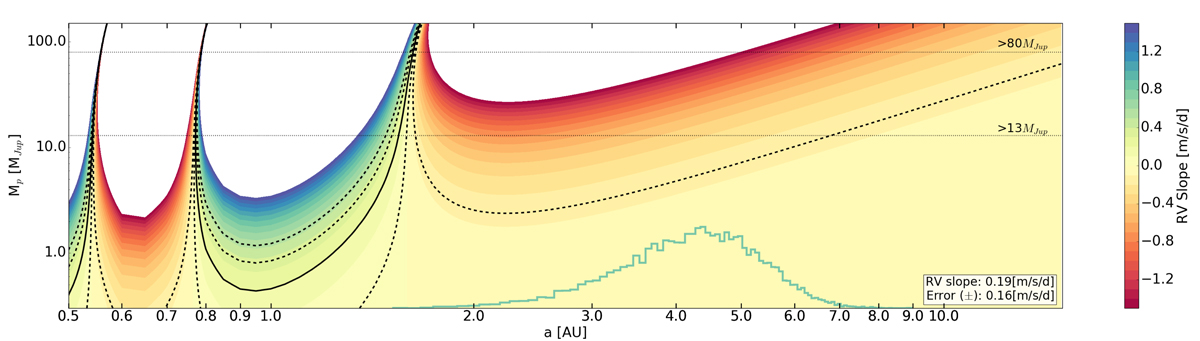
Grid of semi-major axes and planetary masses and their corresponding RV slopes, using observations from CORALIE. The colour scale ranges −1.5 to 1.5 m s−1 day−1, with all else set to white. The slope, with 1 and 2σ errors, of the CORALIE RVs (solid and dashed black lines) shows regions of likely solutions. We also show mass limits for low-mass stars and brown dwarfs (black dashed lines). The Namaste fit of the light curve (see Sect. 3) produces a distribution of semi-major axes (green histogram). The peaks in the grid scale at 0.55, 0.75, and 2 AU are due to RV quadrature for these orbits.
Current usage metrics show cumulative count of Article Views (full-text article views including HTML views, PDF and ePub downloads, according to the available data) and Abstracts Views on Vision4Press platform.
Data correspond to usage on the plateform after 2015. The current usage metrics is available 48-96 hours after online publication and is updated daily on week days.
Initial download of the metrics may take a while.