Fig. 1.
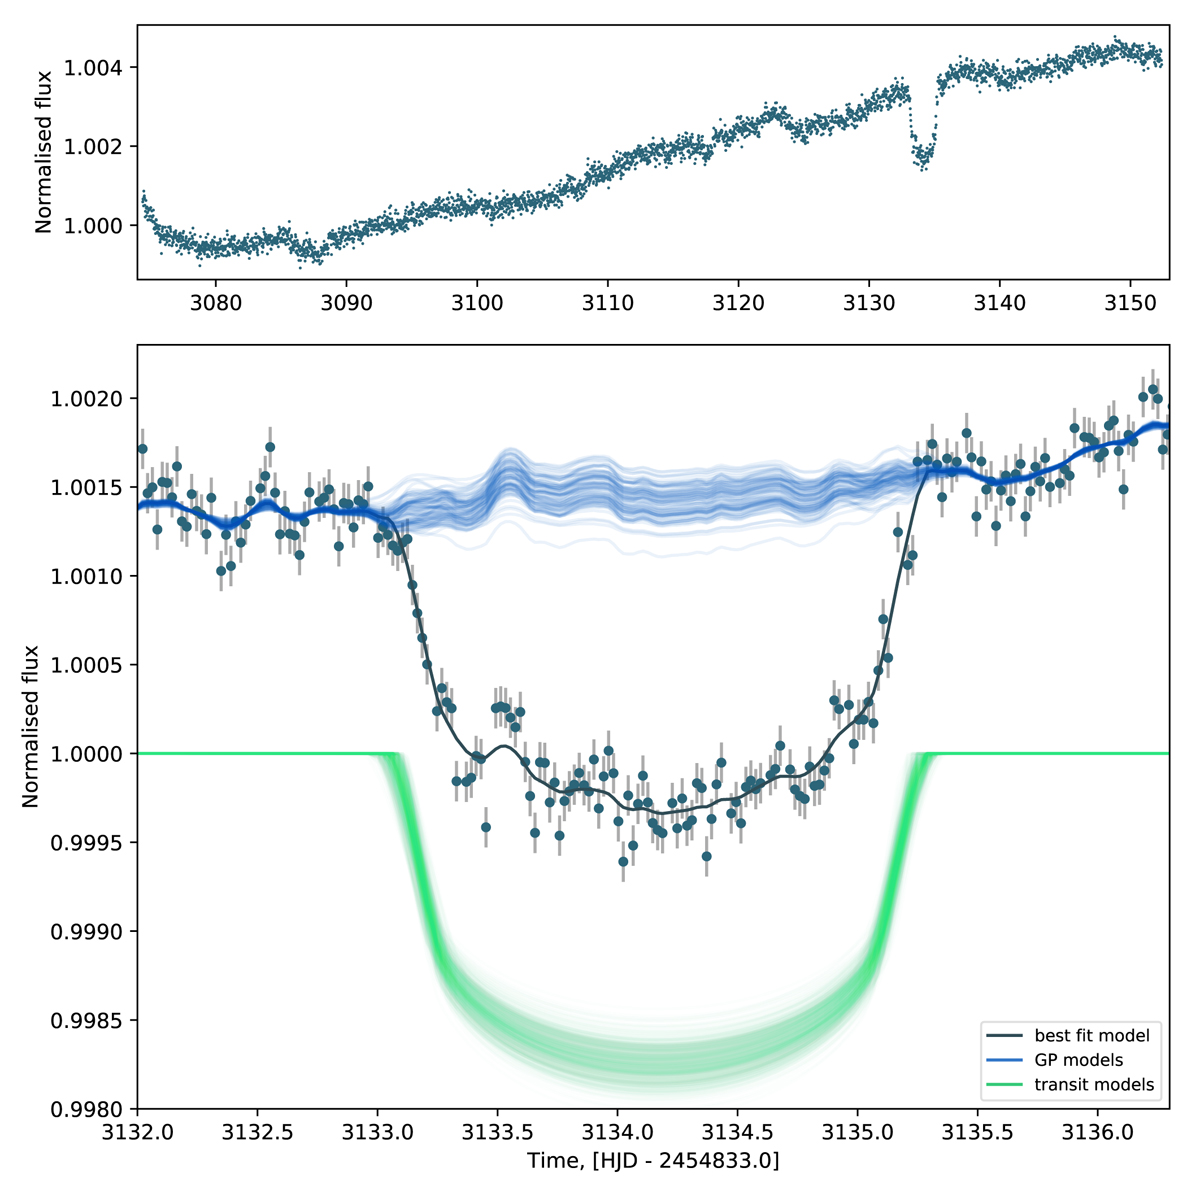
Transit of EPIC248847494b observed by K2 and Namaste models. The upper panel shows the full light curve, and the lower panel shows a zoom of the transit together with the models. The black line shows the best-fit Namaste model. This is composed of the transit model (100 randomly selected models shown in green), and Gaussian process realisations (blue).
Current usage metrics show cumulative count of Article Views (full-text article views including HTML views, PDF and ePub downloads, according to the available data) and Abstracts Views on Vision4Press platform.
Data correspond to usage on the plateform after 2015. The current usage metrics is available 48-96 hours after online publication and is updated daily on week days.
Initial download of the metrics may take a while.