Fig. 6
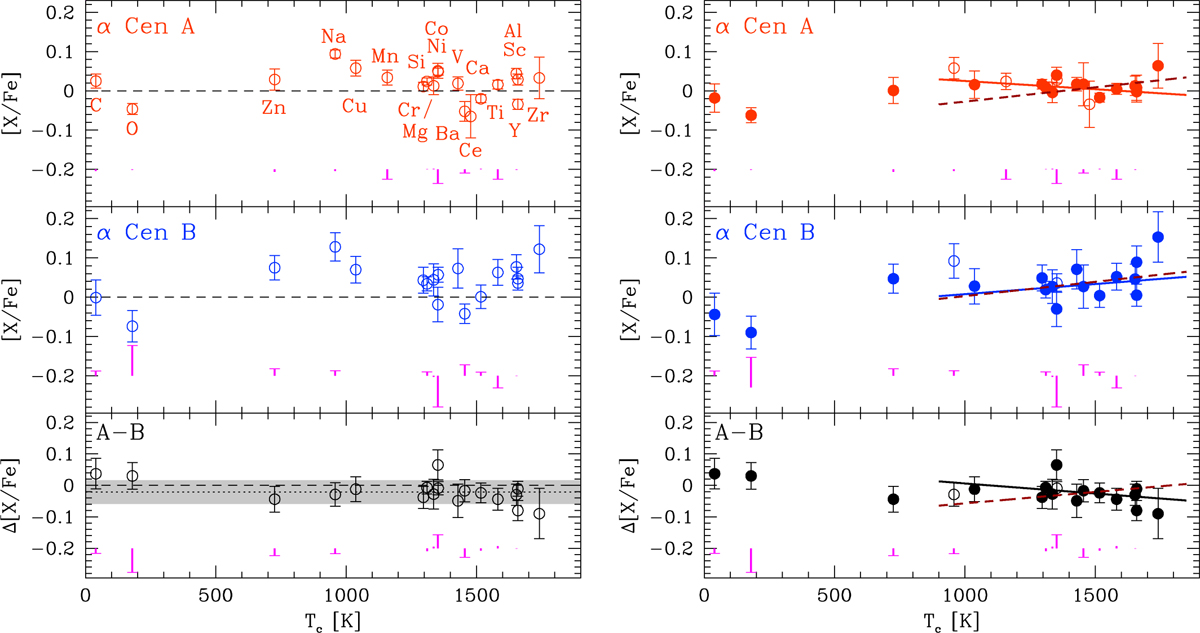
Left panels: abundance patterns as a function of Tc (Lodders 2003). The metal abundances of α Cen A and B relative to iron, [X/Fe], are shown in the top and middle panels, respectively. Bottom panel: abundance differences, Δ[X/Fe], between α Cen A and B. To guide the eye, a dashed line is drawn at Δ[X/Fe] = 0. The dotted line in the bottom panel indicates the mean difference, while the grey strip shows the corresponding 1σ uncertainties. The vertical lines in the bottom of each panel show the non-LTE corrections (non-LTE minus LTE). A horizontal tick at the bottom or top of the line indicates a negative or positive correction, respectively. Values lower than ~0.01 dex are shown with a dot. Right panels: same as left panels, but after correction for GCE. The solid lines are the best linear fits to the refractory elements (Tc > 900 K; Table 4). The elements not included in the fit (Na, Mn, Ni, and Ce) are shown as open circles. The dashed line shows the typical GCE-corrected relationship found for solar analogues (Bedell et al. 2018) after adjustment of the intercept to minimise the residuals.
Current usage metrics show cumulative count of Article Views (full-text article views including HTML views, PDF and ePub downloads, according to the available data) and Abstracts Views on Vision4Press platform.
Data correspond to usage on the plateform after 2015. The current usage metrics is available 48-96 hours after online publication and is updated daily on week days.
Initial download of the metrics may take a while.