Fig. 5
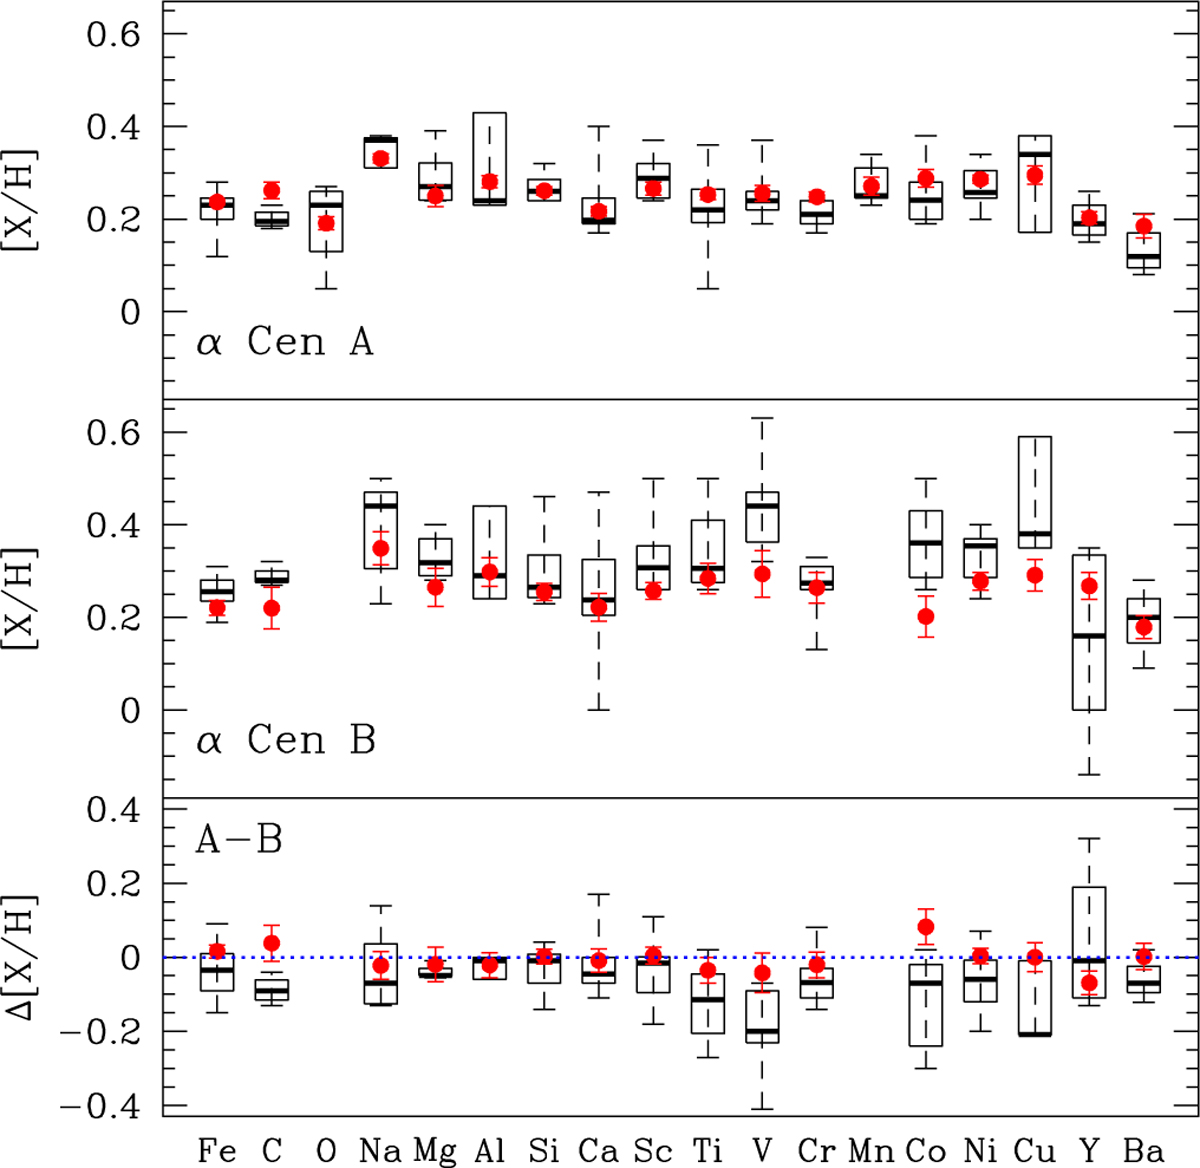
Comparison between our abundances and those from previous studies (listed in Table 2) for elements with at least three measurements available. The vertical dashed line connects the extreme values found. The box covers the first to third quartile of the literature data, while the thick horizontal line inside the box shows the median. Our results are overplotted as red, filled circles. To guide the eye, a dotted line is drawn in the bottom panel at Δ [X/H] = 0. Our uncertainties for elements other than iron refer to [X/Fe], not [X/H]. However, they are expected to be representative.
Current usage metrics show cumulative count of Article Views (full-text article views including HTML views, PDF and ePub downloads, according to the available data) and Abstracts Views on Vision4Press platform.
Data correspond to usage on the plateform after 2015. The current usage metrics is available 48-96 hours after online publication and is updated daily on week days.
Initial download of the metrics may take a while.