Fig. 2
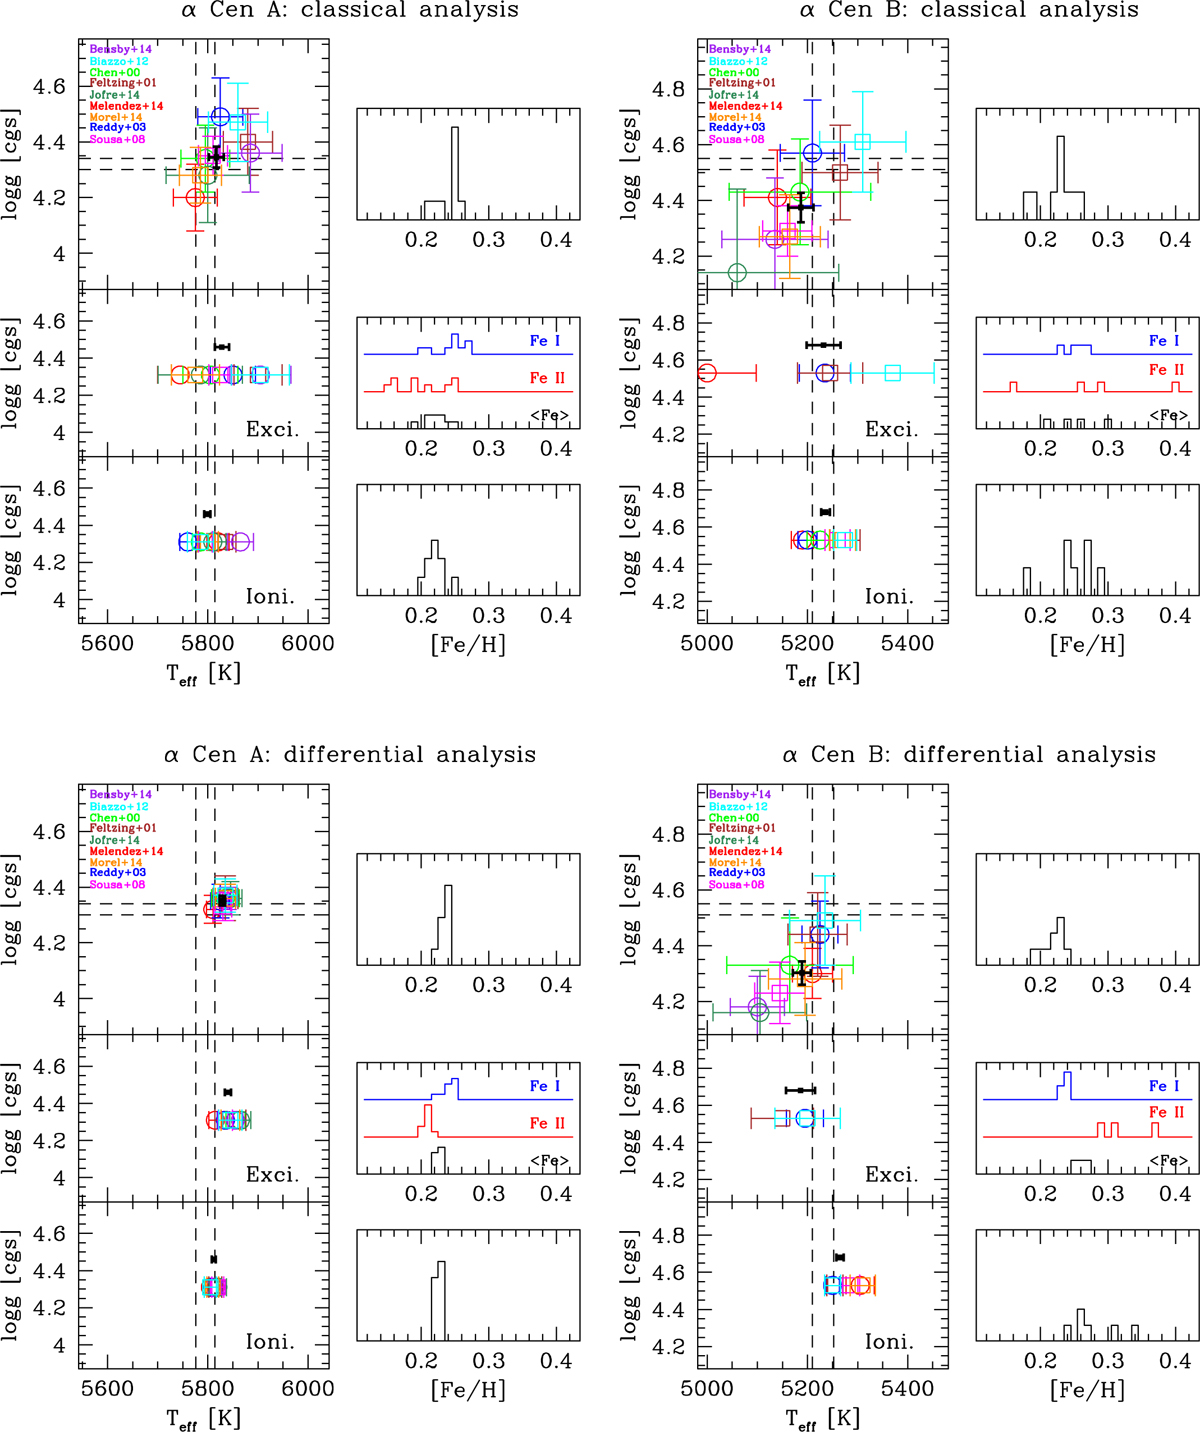
Results of the classical (top) and differential (bottom) analyses of α Cen A (left) and α Cen B (right). Various analyses are considered (see Sect. 4.2): unconstrained (top panels), constrained assuming excitation balance (middle panels), and constrained assuming ionisation balance (bottom panels). The Teff and log g values obtained for each line list are shown with a different colour. The vertical and horizontal dashed lines indicate the 1σ range encompassed by the reference Teff and log g values (Sect. 4.2). The black error bars indicate the weighted mean of all the results (the position along the y-axis in the middle and bottom panels is shifted for clarity). The full results can be found in Tables B.1 and B.2.
Current usage metrics show cumulative count of Article Views (full-text article views including HTML views, PDF and ePub downloads, according to the available data) and Abstracts Views on Vision4Press platform.
Data correspond to usage on the plateform after 2015. The current usage metrics is available 48-96 hours after online publication and is updated daily on week days.
Initial download of the metrics may take a while.