Fig. 1
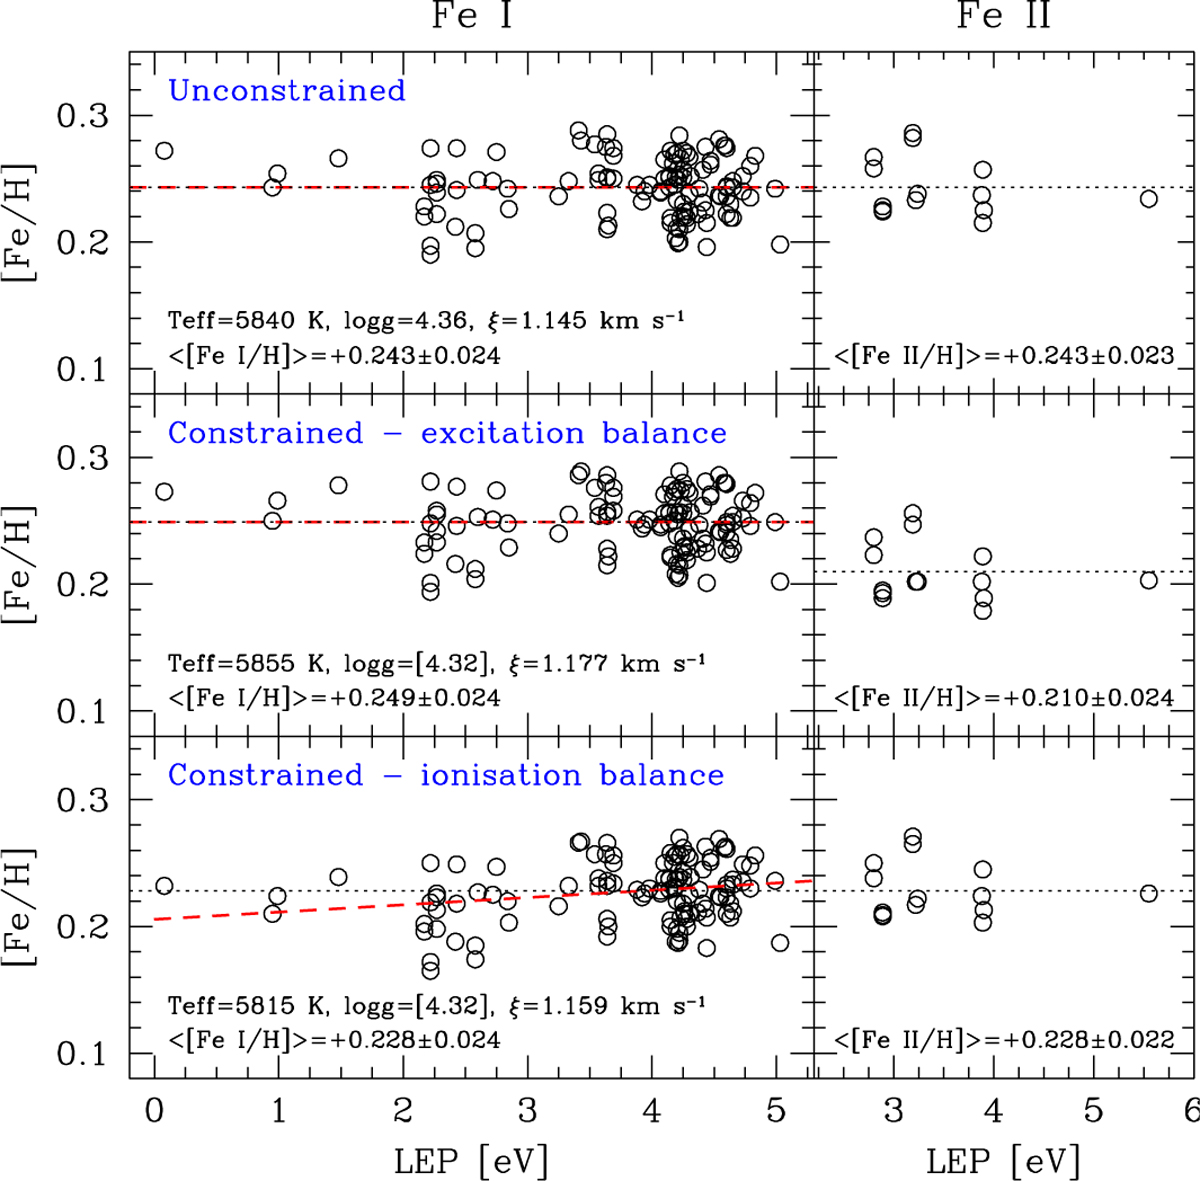
Illustration of the three methods employed in the case of the differential analysis of α Cen A withthe line list of Bensby et al. (2014). Upper panels: unconstrained analysis requiring both excitation and ionisation equilibrium of iron; middle panels: constrained analysis assuming excitation balance of Fe I; bottom panels: constrained analysis assuming ionisation balance of iron. The dotted horizontal lines indicate the mean iron abundances, while the red dashed lines show the fit to the Fe I abundances as a function of LEP.
Current usage metrics show cumulative count of Article Views (full-text article views including HTML views, PDF and ePub downloads, according to the available data) and Abstracts Views on Vision4Press platform.
Data correspond to usage on the plateform after 2015. The current usage metrics is available 48-96 hours after online publication and is updated daily on week days.
Initial download of the metrics may take a while.