Fig. 3.
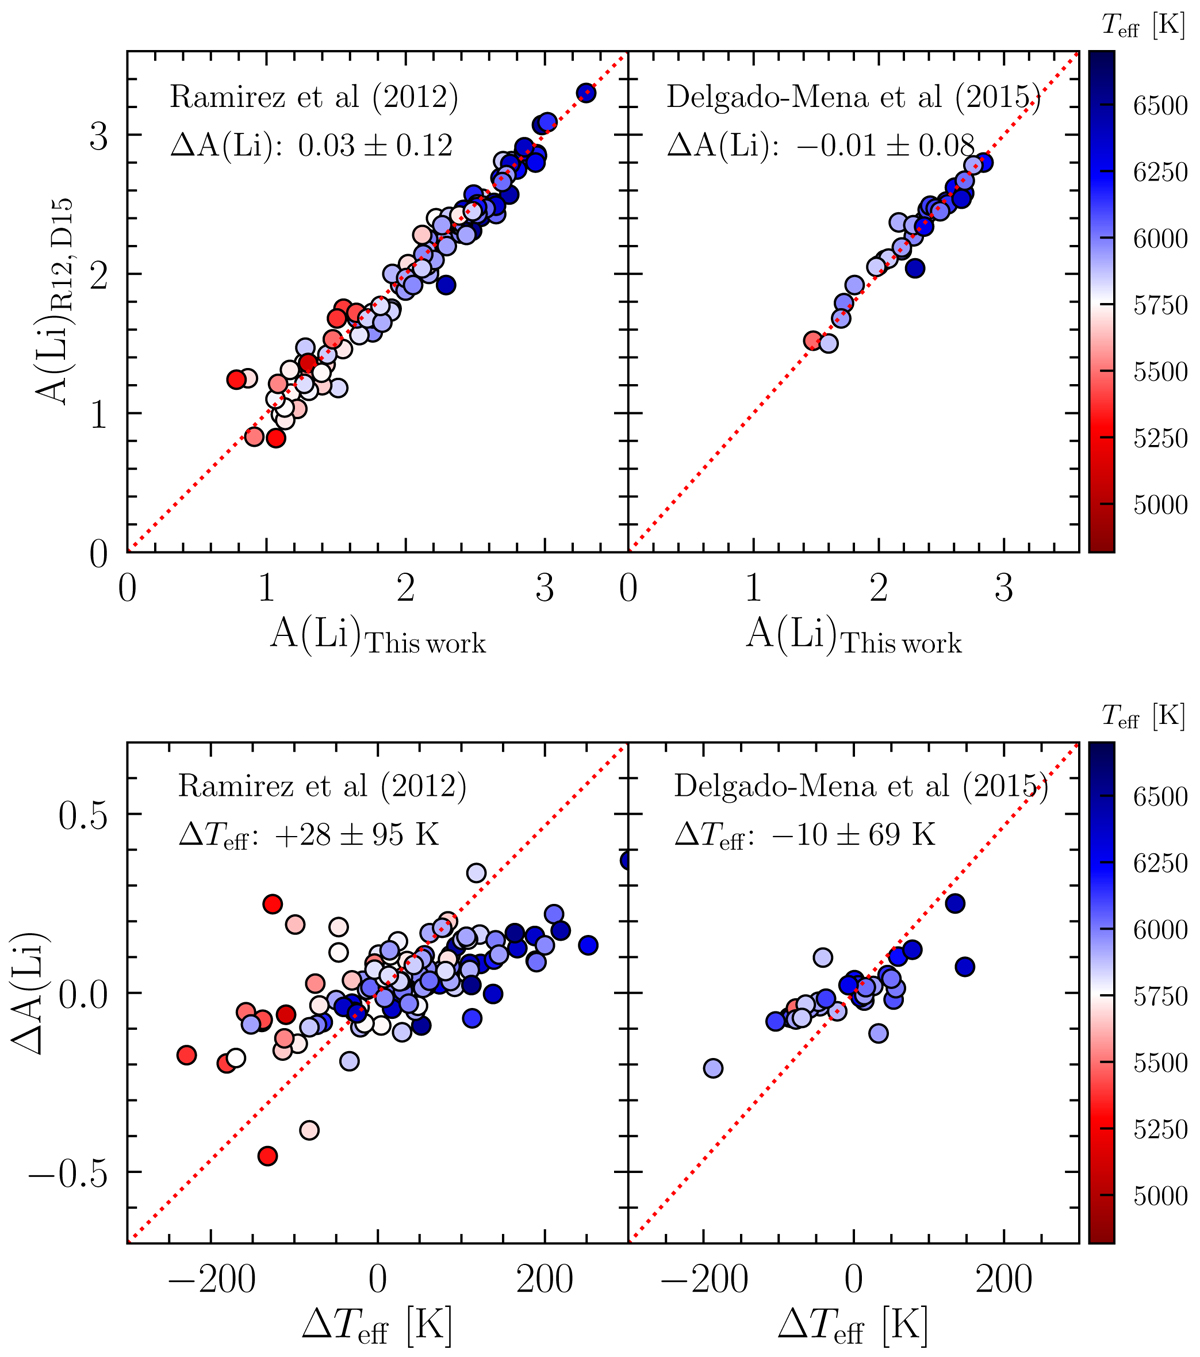
Left-hand plots: comparisons of Li abundances and effective temperatures for 117 stars in common with Ramírez et al. (2012); right-hand plots: comparisons for 33 stars in common with Delgado Mena et al. (2015). The red dotted lines show the one-to-one relationships, and the average differences (ΔA(Li) and ΔTeff, calculated as our values minus theirs) and one sigma dispersions are indicated in the plots. The stars have been colour-coded according to their effective temperatures.
Current usage metrics show cumulative count of Article Views (full-text article views including HTML views, PDF and ePub downloads, according to the available data) and Abstracts Views on Vision4Press platform.
Data correspond to usage on the plateform after 2015. The current usage metrics is available 48-96 hours after online publication and is updated daily on week days.
Initial download of the metrics may take a while.