Fig. 1.
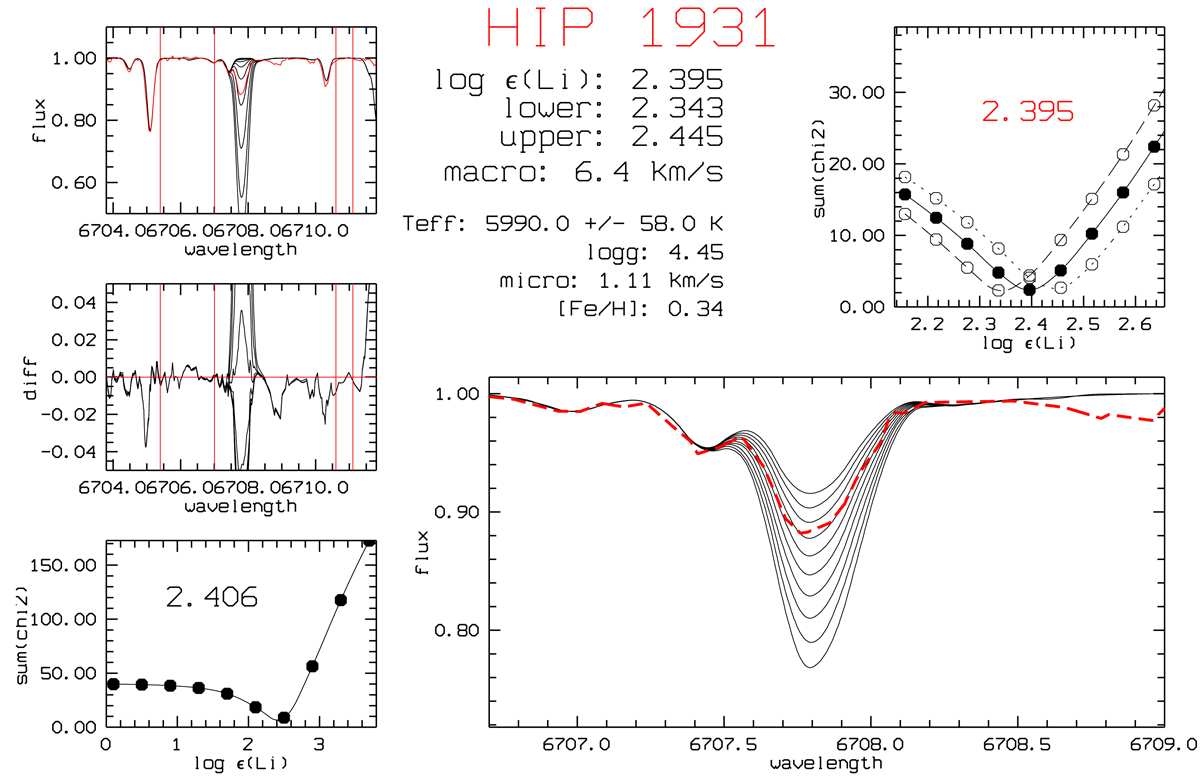
Fitting routine for the Li feature at 670.7 nm. A grid of spectra with ten different Li abundances in steps of 0.3 dex is created in the range 0.1–3.7 dex to obtain a first estimate. This is shown in the three panels on the left-hand side: top: observed spectrum (red line) and ten synthetic spectra; middle: difference between observed and synthetic spectra; bottom: sum of the squared difference as a function of Li abundance, where the minimum gives a first estimate of the Li abundance. A new set of ten spectra with Li in steps of 0.06 dex around the first estimate is then created and shown in the large panel on the right-hand side. The sum of the squared difference between observed and synthetic spectra is used to find the best abundance (shown in the top panel on right-hand side). The process is repeated taking the uncertainties in the effective temperature into account, giving the upper and lower uncertainties of the Li abundance (shown by the empty circles in the top panel on the right-hand side).
Current usage metrics show cumulative count of Article Views (full-text article views including HTML views, PDF and ePub downloads, according to the available data) and Abstracts Views on Vision4Press platform.
Data correspond to usage on the plateform after 2015. The current usage metrics is available 48-96 hours after online publication and is updated daily on week days.
Initial download of the metrics may take a while.