Fig. 7.
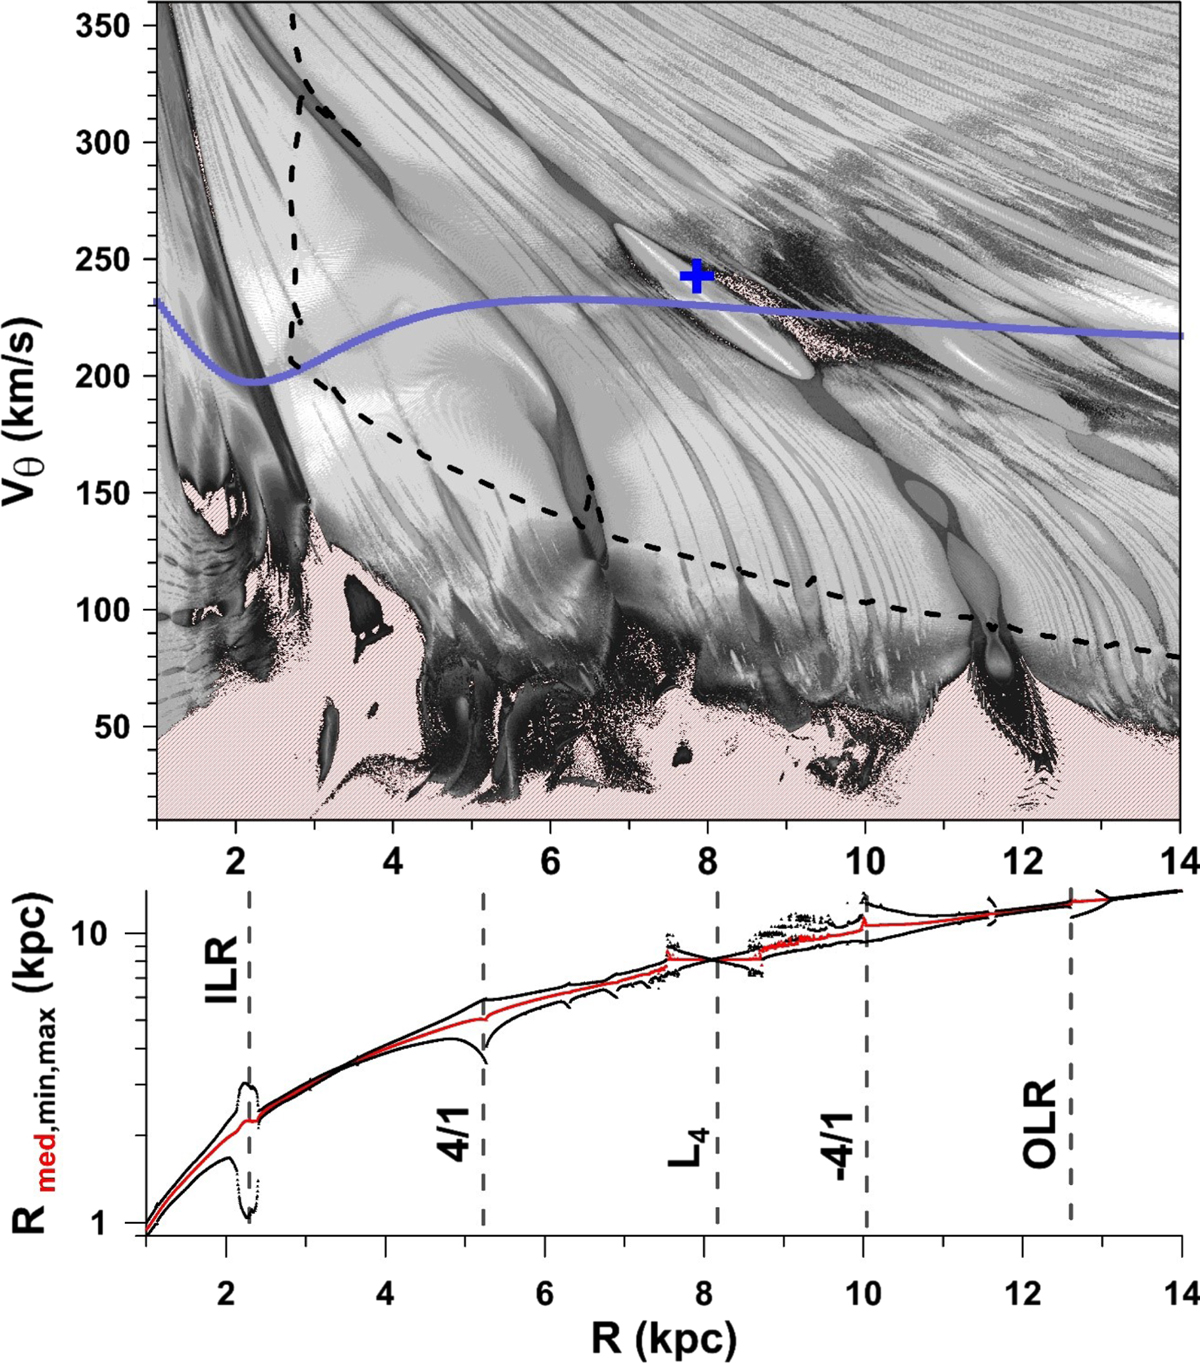
Top panel: same as in Fig. 6 (top panel), except adding the spiral arms perturbation. Bottom: the averaged (red) and maximal/minimal (black) values of the R-variable calculated over 10 Gyr as function of initial values of R. The locations of the L4-corotation and the strongest resonances are indicated by vertical dashed lines.
Current usage metrics show cumulative count of Article Views (full-text article views including HTML views, PDF and ePub downloads, according to the available data) and Abstracts Views on Vision4Press platform.
Data correspond to usage on the plateform after 2015. The current usage metrics is available 48-96 hours after online publication and is updated daily on week days.
Initial download of the metrics may take a while.