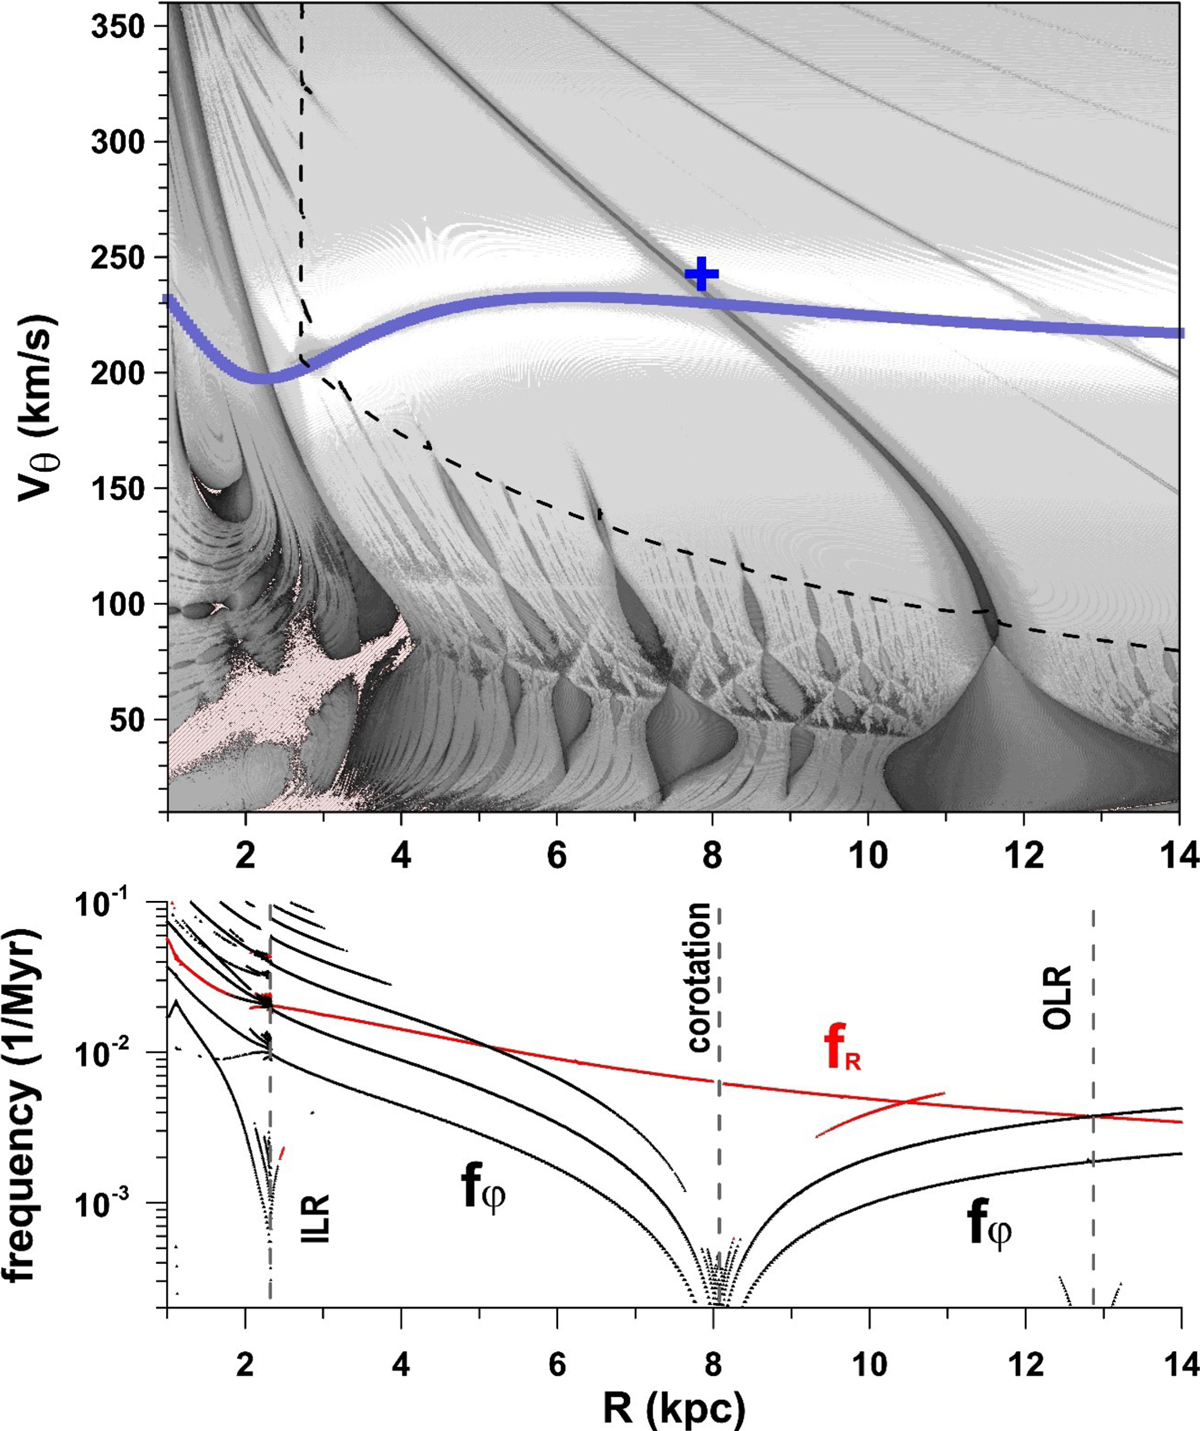
Fig. 6.
Top panel: dynamical map on the R–Vθ plane constructed with only the bar/bulge perturbation, for the basic set of parameters (Table 1) and the initial pR = 0 and φ = 78.°8 (see text). The light grey tones represent regular orbits, while increasingly dark tones correspond to increasing instabilities and chaotic motion. The red-hatched regions contain strongly unstable and escaping orbits. The rotation curve is shown by a blue line. A dashed line delimits the initial conditions whose trajectories are inside or cross the central bar. The position of the Sun is shown by a blue cross symbol. Bottom panel: dynamical spectrum calculated with the bar model, along with a rotation curve shown by the continuous blue curve in the top panel. The proper frequency of the azimuthal oscillation, fφ, and its harmonics are represented by black lines, while the frequency of the radial oscillation, fR, is represented by a red line. The location of the corotation, ILR and OLR, is indicated by vertical dashed lines.
Current usage metrics show cumulative count of Article Views (full-text article views including HTML views, PDF and ePub downloads, according to the available data) and Abstracts Views on Vision4Press platform.
Data correspond to usage on the plateform after 2015. The current usage metrics is available 48-96 hours after online publication and is updated daily on week days.
Initial download of the metrics may take a while.