Fig. 5.
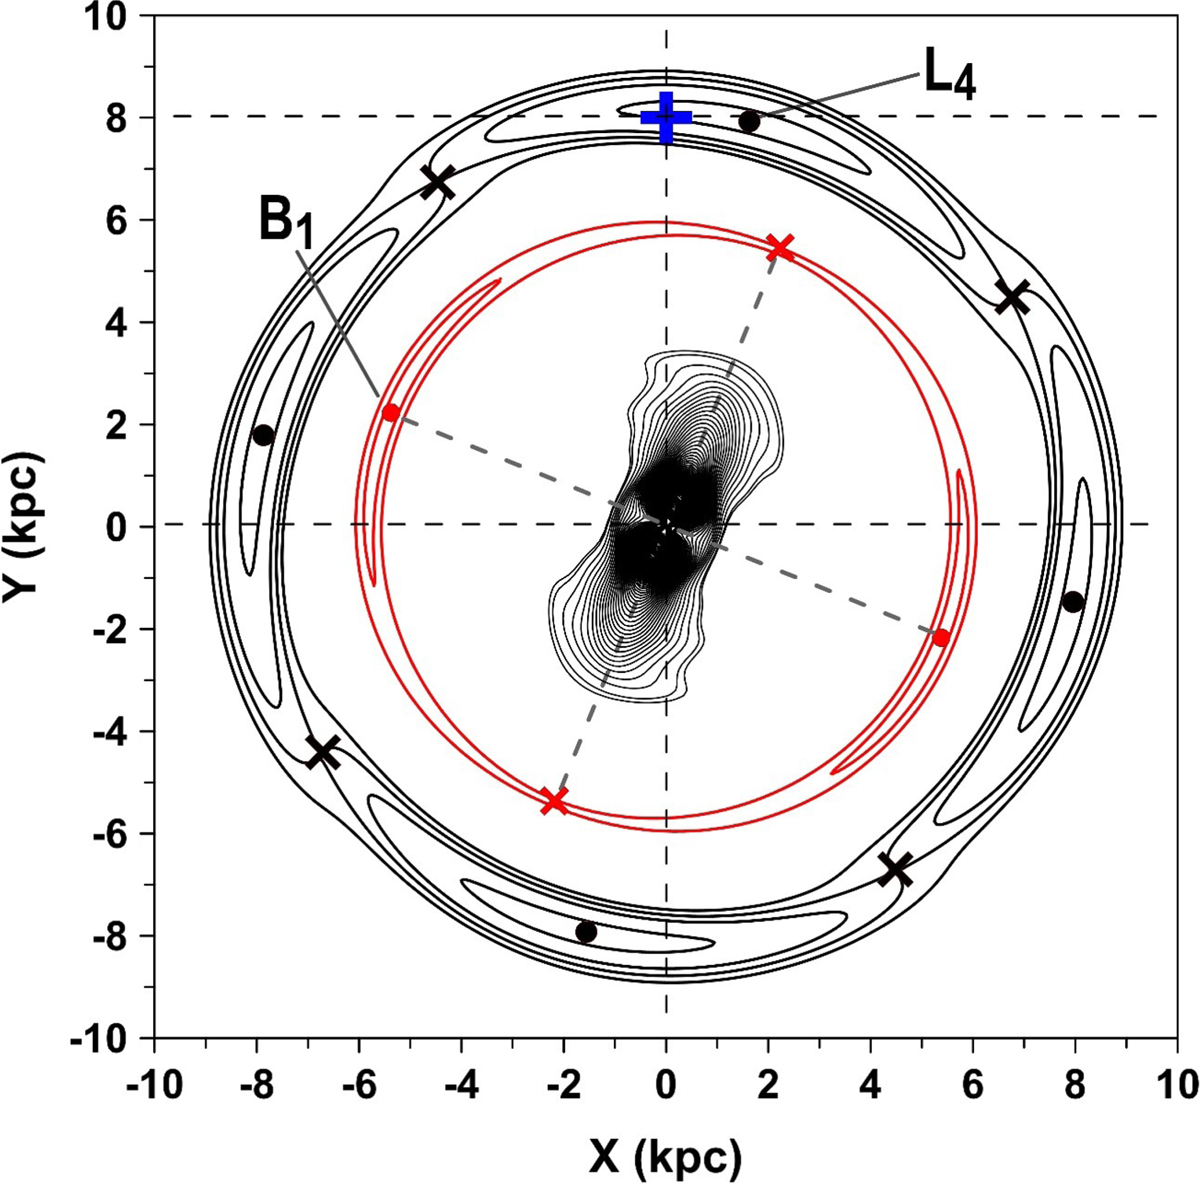
Corotation zones originated by the four-arm spiral perturbation, with Ωsp = 28.5 km s−1 kpc−1 (black), and by the central bar perturbation, with Ωbar = 40.0 km s−1 kpc−1 (red). The different pattern speeds were chosen with the purpose of showing each contribution separately. The values of other parameters were taken from Table 1. The zone of influence of the bar is centred at the origin; the directions of the major and minor axes of the bar are shown by dashed lines. The positions of the stable corotation centres are shown by dots, while the positions of the unstable saddle points are shown by crosses (see text for details). The position of the Sun is shown by a blue cross symbol.
Current usage metrics show cumulative count of Article Views (full-text article views including HTML views, PDF and ePub downloads, according to the available data) and Abstracts Views on Vision4Press platform.
Data correspond to usage on the plateform after 2015. The current usage metrics is available 48-96 hours after online publication and is updated daily on week days.
Initial download of the metrics may take a while.