Fig. 4.
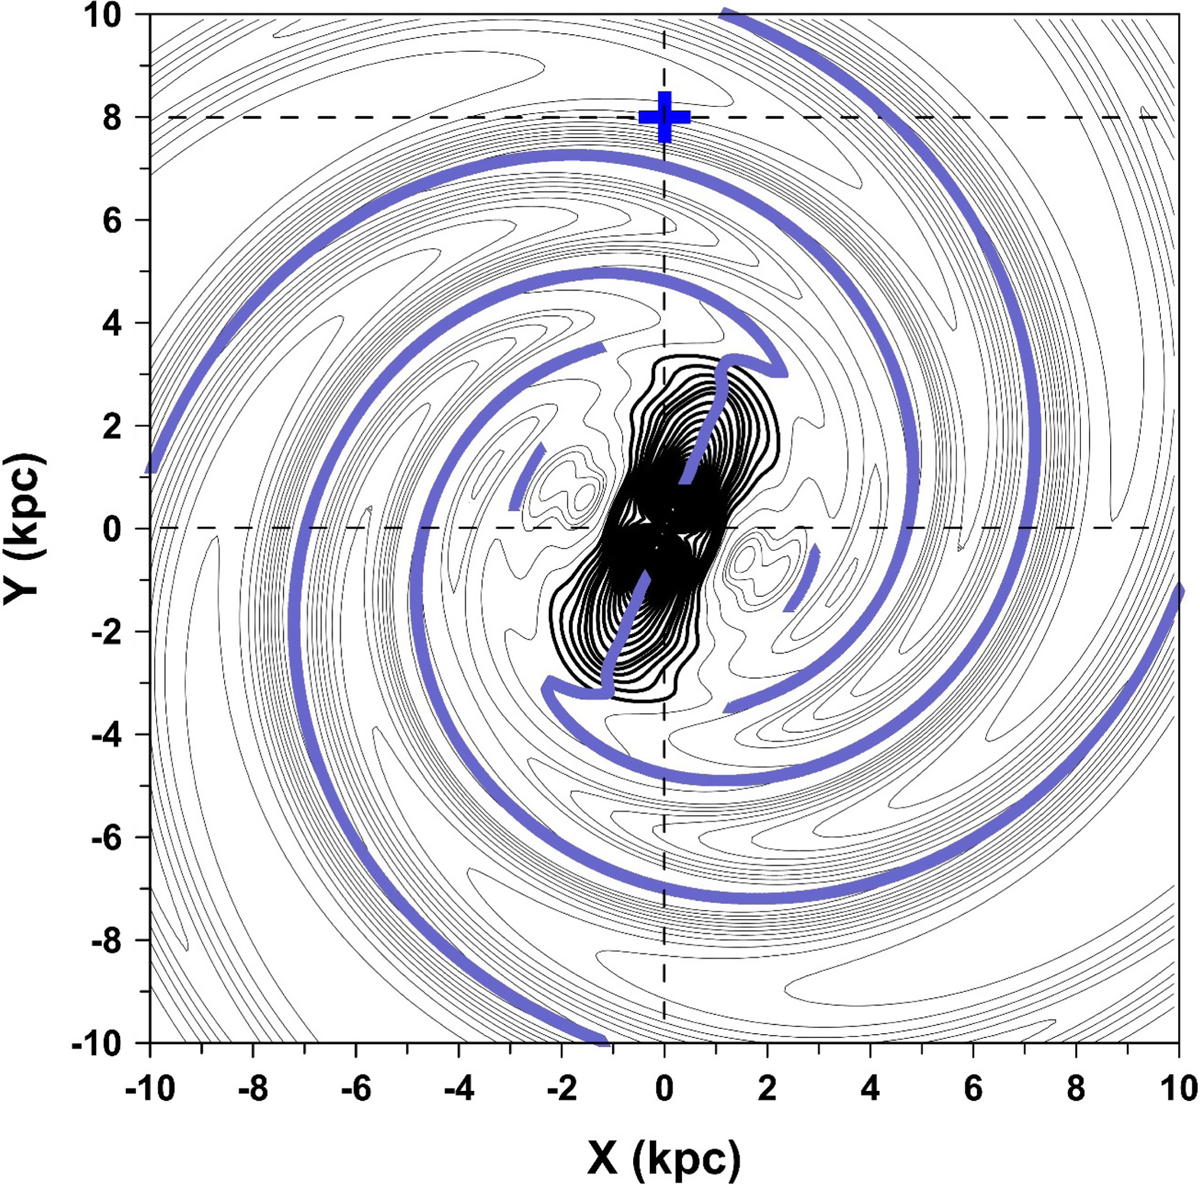
Energy levels of the perturbation potential ℋ1(R, φ) on the representative XY-plane. The levels for which the bar’s perturbations are dominating are emphasised, showing the zone of influence of the bar. The position of the Sun is shown by a blue cross. The blue spiral curves are the azimuthal minima of the potential ℋ1(R, φ): outside the zone of influence of the bar; they correspond to the loci of the main spiral arms in our model. In calculations, we used the parameter’s values from Table 1.
Current usage metrics show cumulative count of Article Views (full-text article views including HTML views, PDF and ePub downloads, according to the available data) and Abstracts Views on Vision4Press platform.
Data correspond to usage on the plateform after 2015. The current usage metrics is available 48-96 hours after online publication and is updated daily on week days.
Initial download of the metrics may take a while.