Fig. 3.
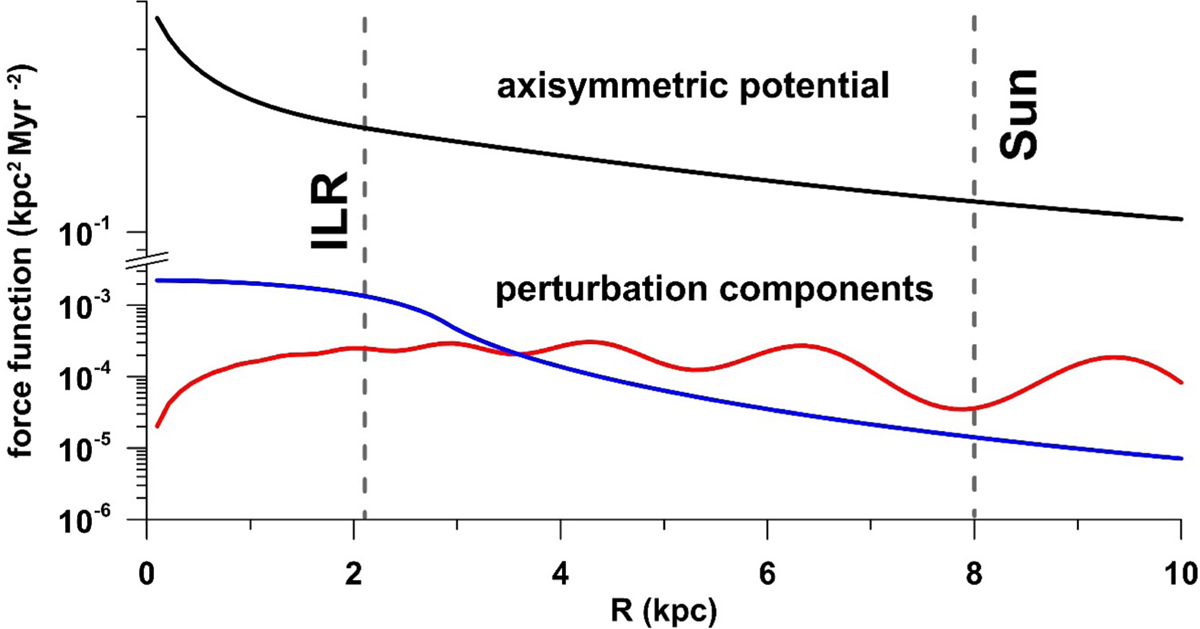
Top: axisymmetric potential Φ0(R) from Eq. (3) (units are M⊙, kpc, and Myr). Positions of the Sun and the ILR are indicated by the vertical lines at 8 kpc and 2.13 kpc, respectively. Bottom: equatorial non-axisymmetric components of the perturbation potential: the spiral arms perturbation, Φsp(R, φ) (red curve), and the bar perturbation, Φbar(R, φ) (blue curve). The calculations were done in direction of the bar’s major axis, with the phase φ = 67.°5, and with the parameters taken from Table 1. We note that all components are plotted with positive sign, in logarithmic scale; in this case, they are referred to as force functions.
Current usage metrics show cumulative count of Article Views (full-text article views including HTML views, PDF and ePub downloads, according to the available data) and Abstracts Views on Vision4Press platform.
Data correspond to usage on the plateform after 2015. The current usage metrics is available 48-96 hours after online publication and is updated daily on week days.
Initial download of the metrics may take a while.