Fig. 16.
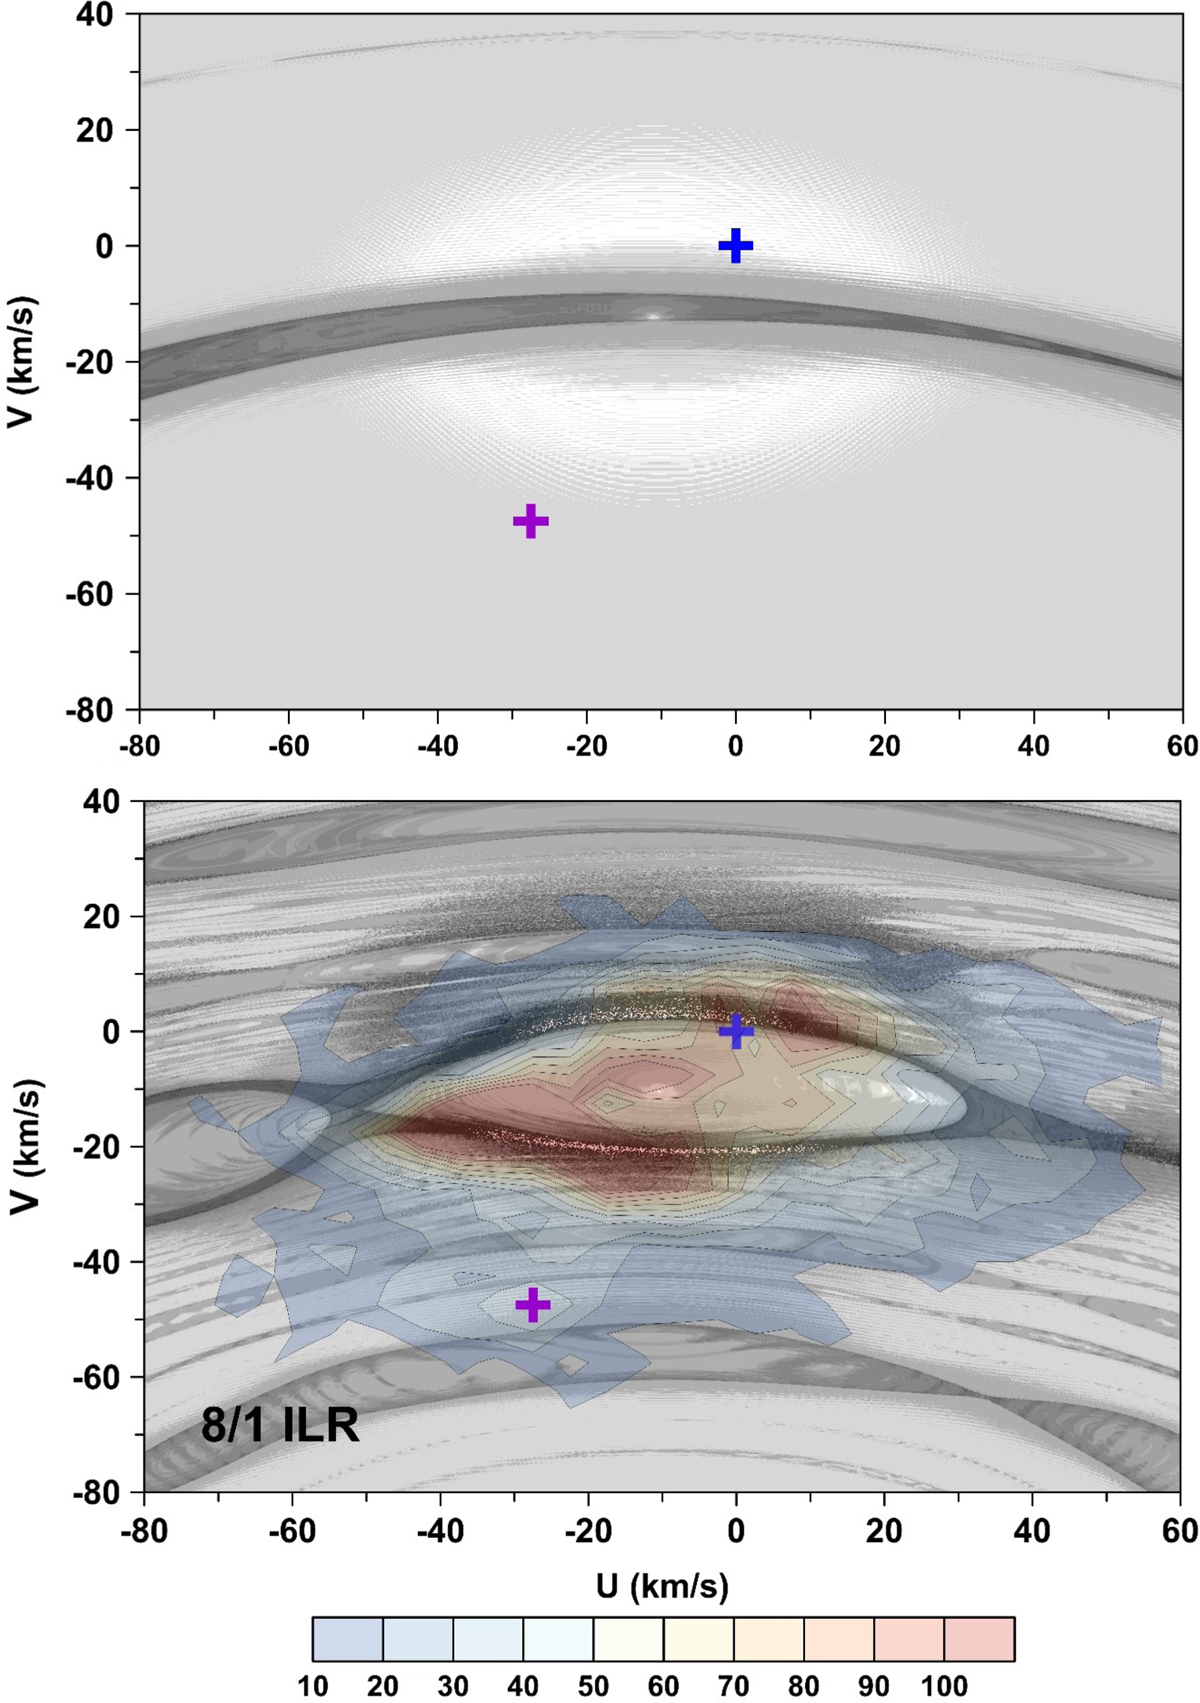
Top panel: dynamical map on the heliocentric U–V plane. Only perturbations due to the central bar/bulge are accounted. The light gray tones represent regular orbits, while increasingly dark tones correspond to increasing instabilities and chaotic motion. The position of the Sun and of the density peak of Hercules are shown by blue and magenta crosses, respectively. Bottom panel: same as on the top graph, except including perturbations due to the spiral arms; the values of the parameters are taken from Table 1. The iso-density contours of the density of stars are superimposed and the color bar associates the colors to the density values (in units of number of objects per a bin of 4 × 4 km s−1).
Current usage metrics show cumulative count of Article Views (full-text article views including HTML views, PDF and ePub downloads, according to the available data) and Abstracts Views on Vision4Press platform.
Data correspond to usage on the plateform after 2015. The current usage metrics is available 48-96 hours after online publication and is updated daily on week days.
Initial download of the metrics may take a while.