Fig. 15.
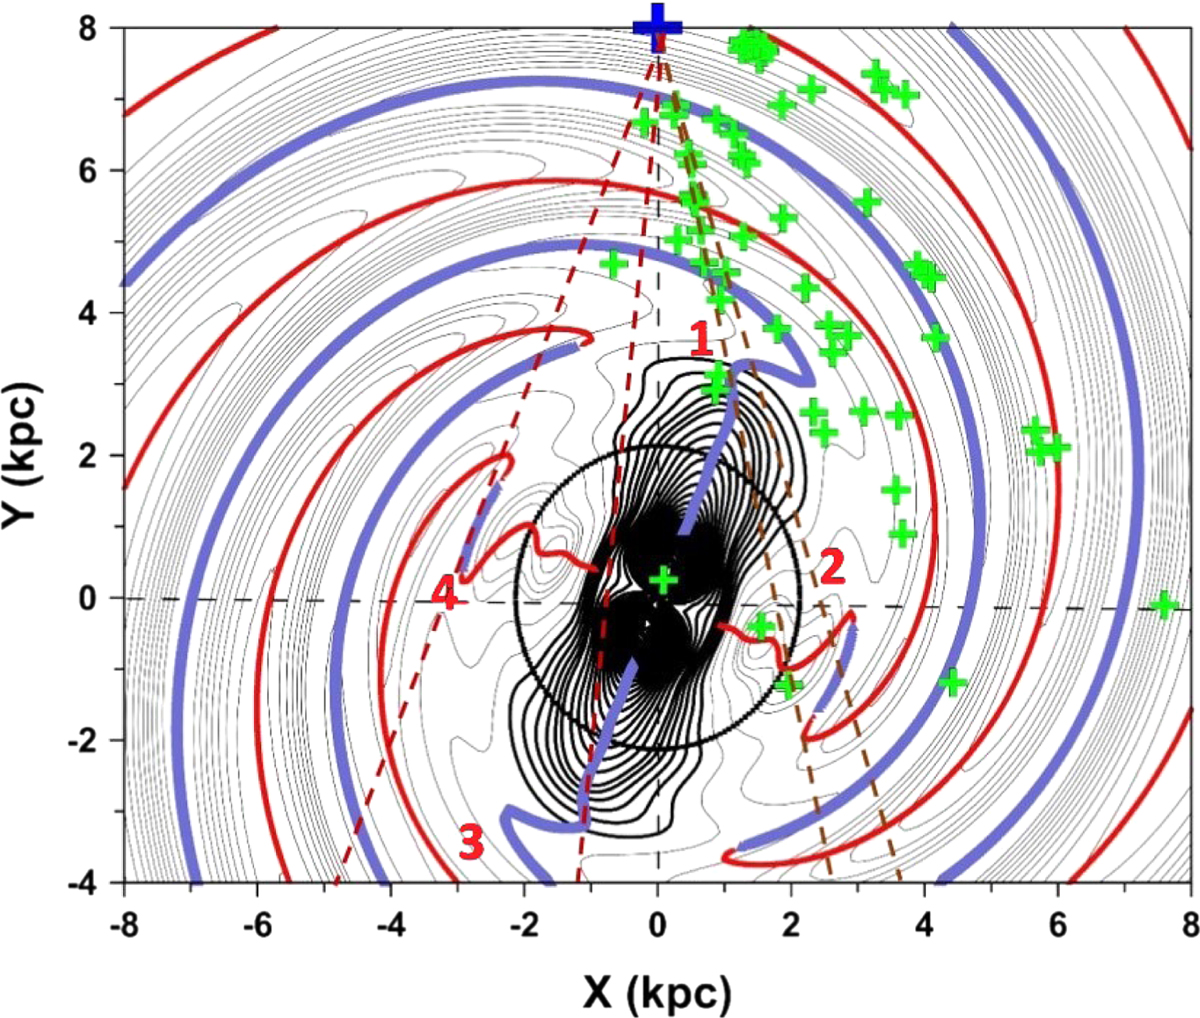
As in Fig. 4. The regions from 1 to 4 in the central zone of the Galaxy are defined in the text. Green crosses are masers with VLBI measurement of distance. Blue lines represent potential minima (spiral arms) and red lines potential maxima. The brown dashed lines are tangential lines passing through regions from 1 to 4. The circle represents the radius of the ILR of the spiral structure, which is the same as the bar if we adopt the same rotation speed of the two components.
Current usage metrics show cumulative count of Article Views (full-text article views including HTML views, PDF and ePub downloads, according to the available data) and Abstracts Views on Vision4Press platform.
Data correspond to usage on the plateform after 2015. The current usage metrics is available 48-96 hours after online publication and is updated daily on week days.
Initial download of the metrics may take a while.