Fig. 14.
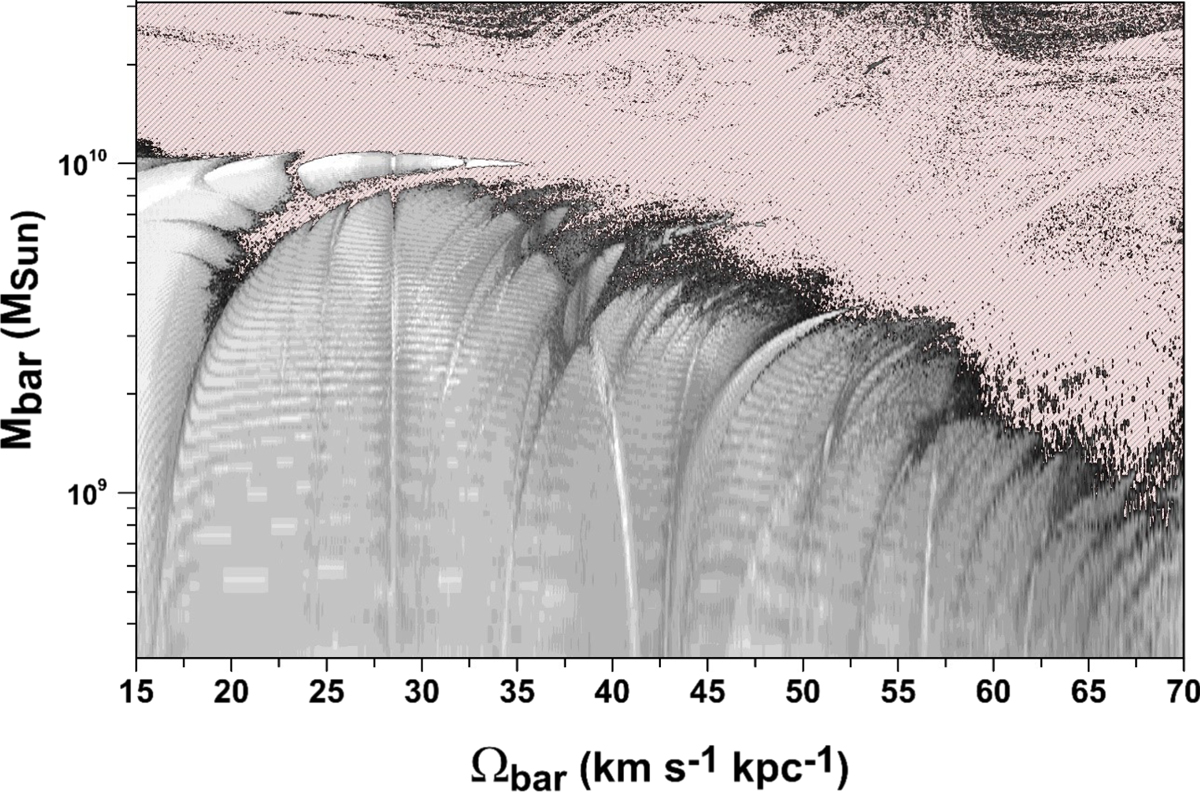
Dynamical map on the parametric plane Ω
bar–M
bar for the orbit with initial conditions ![]() , pR
= 0 and Vθ
= V
rot(R
bar), representative of the bar structure. The light grey tones represent regular orbits, while increasingly dark tones correspond to increasing instabilities and chaotic motion. The red-hatched regions contain strongly unstable and escaping orbits. We see that, in order to have stability, one must always have M
bar < 1010
M
⊙. This value decreases with Ω
bar. For high values of Ω
bar, the region with M
bar ~ 109
M
⊙ is unstable.
, pR
= 0 and Vθ
= V
rot(R
bar), representative of the bar structure. The light grey tones represent regular orbits, while increasingly dark tones correspond to increasing instabilities and chaotic motion. The red-hatched regions contain strongly unstable and escaping orbits. We see that, in order to have stability, one must always have M
bar < 1010
M
⊙. This value decreases with Ω
bar. For high values of Ω
bar, the region with M
bar ~ 109
M
⊙ is unstable.
Current usage metrics show cumulative count of Article Views (full-text article views including HTML views, PDF and ePub downloads, according to the available data) and Abstracts Views on Vision4Press platform.
Data correspond to usage on the plateform after 2015. The current usage metrics is available 48-96 hours after online publication and is updated daily on week days.
Initial download of the metrics may take a while.