Fig. 10.
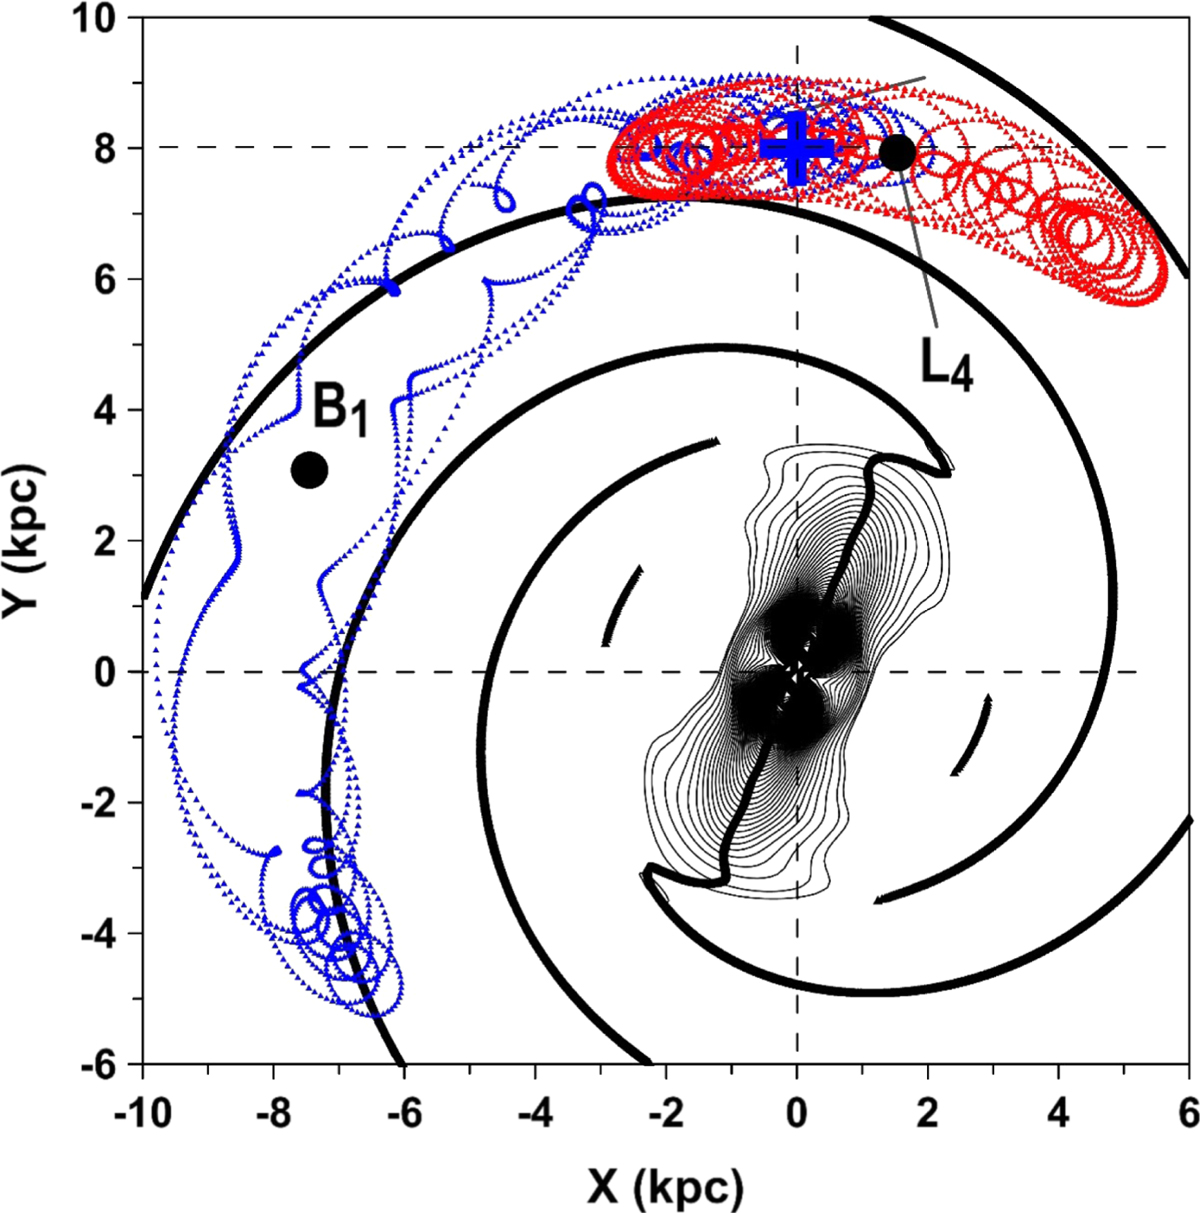
Two projections of the Sun’s orbit on the X–Y plane, calculated with M bar = 1 × 10⁹M⊙ (red) and Mbar = 3 × 10¹⁰M⊙ (blue), over 5 Gyr; all other parameters are taken from Table 1. The initial position of the Sun is shown by a blue cross. For the smaller bar’s mass, the Sun’s trajectory oscillates around the L4-centre, while, for the larger mass, it oscillates around the B1-centre. The zone of influence of the bar/bulge and the loci of the spiral arms are shown by black curves.
Current usage metrics show cumulative count of Article Views (full-text article views including HTML views, PDF and ePub downloads, according to the available data) and Abstracts Views on Vision4Press platform.
Data correspond to usage on the plateform after 2015. The current usage metrics is available 48-96 hours after online publication and is updated daily on week days.
Initial download of the metrics may take a while.