Fig. 1
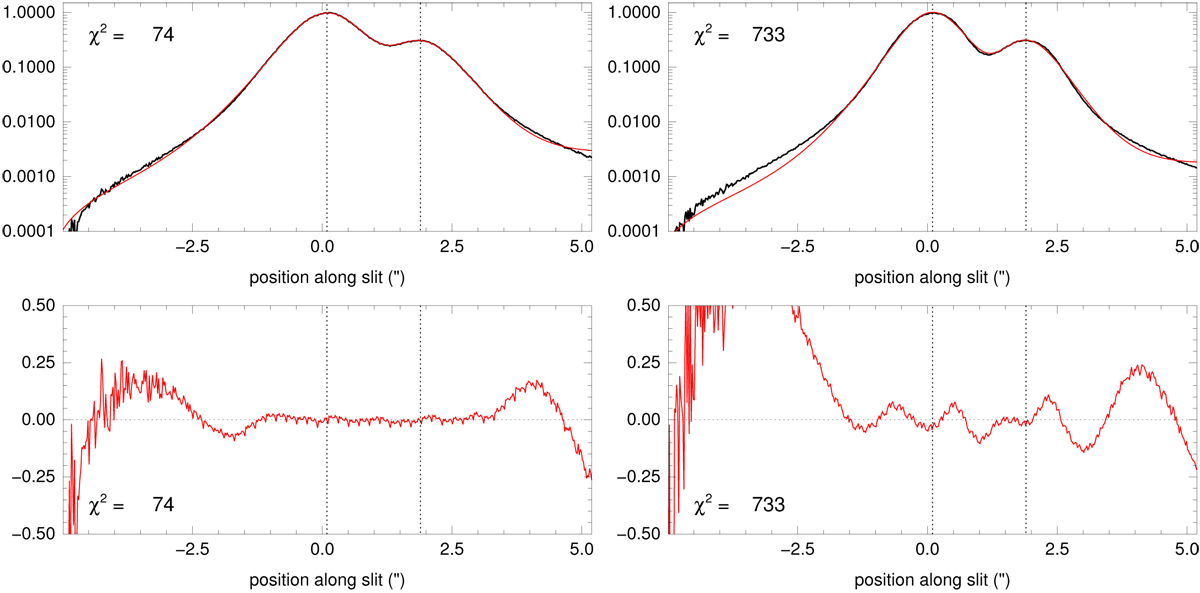
Top panel: comparison between subsampled collapsed spatial profiles for a selected exposure (left panel) and a rejected one (right panel) for the 2017 September 7 observations of η Ori AaAb+B. Solid black is used for the observed profile, solid red for the fit, and dotted black for the star positions. Bottom panel: same as top panels but for the normalized residual i.e. (observed-fit)/fit. The selected exposure has a more symmetric profile than the rejected one, yielding a much lower χ2 and a reduced contamination of the primary on the secondary.
Current usage metrics show cumulative count of Article Views (full-text article views including HTML views, PDF and ePub downloads, according to the available data) and Abstracts Views on Vision4Press platform.
Data correspond to usage on the plateform after 2015. The current usage metrics is available 48-96 hours after online publication and is updated daily on week days.
Initial download of the metrics may take a while.