Fig. 4
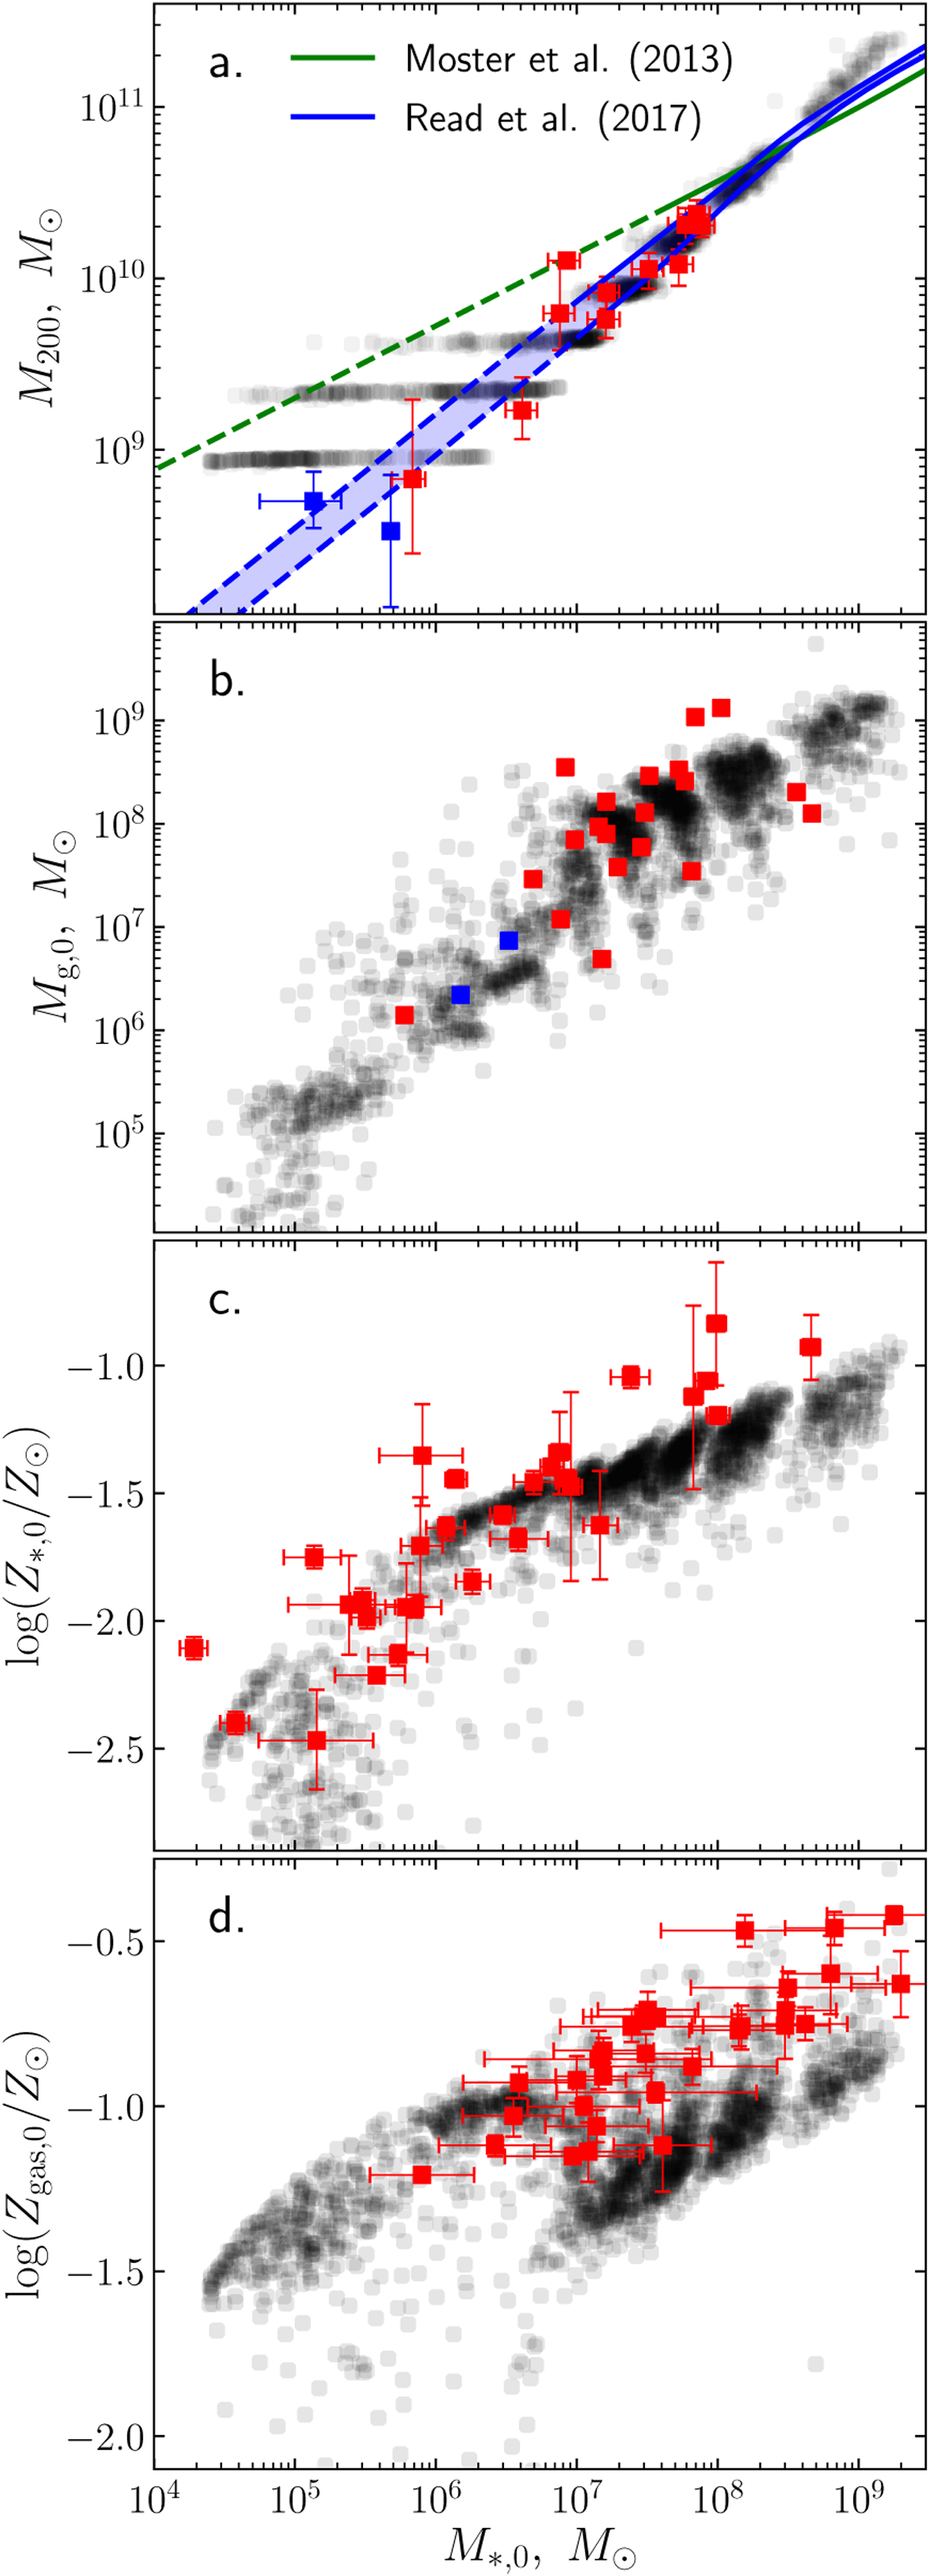
Relations between present-day stellar mass and dark matter halo virial mass (a), gas mass (b), average stellar metallicity (c), and average gas metallicity (d). Black points represent models and red points represent observations. Panel a: Read et al. (2017), panel b: Oh et al. (2015) and Kirby et al. (2017), panel c: Kirby et al. (2013), and panel d: Berg et al. (2012). Blue points in panel a represent the non-isolated galaxies Carina and Leo T, while in panel b, these points represent the galaxies Leo A and Aquarius, which are the focus of this work. Green and blue lines show the M*,0 –Mdm,0 relations from abundance matching (Moster et al. 2013; Read et al. 2017), and dashed lines denote extrapolation.
Current usage metrics show cumulative count of Article Views (full-text article views including HTML views, PDF and ePub downloads, according to the available data) and Abstracts Views on Vision4Press platform.
Data correspond to usage on the plateform after 2015. The current usage metrics is available 48-96 hours after online publication and is updated daily on week days.
Initial download of the metrics may take a while.