Fig. 6
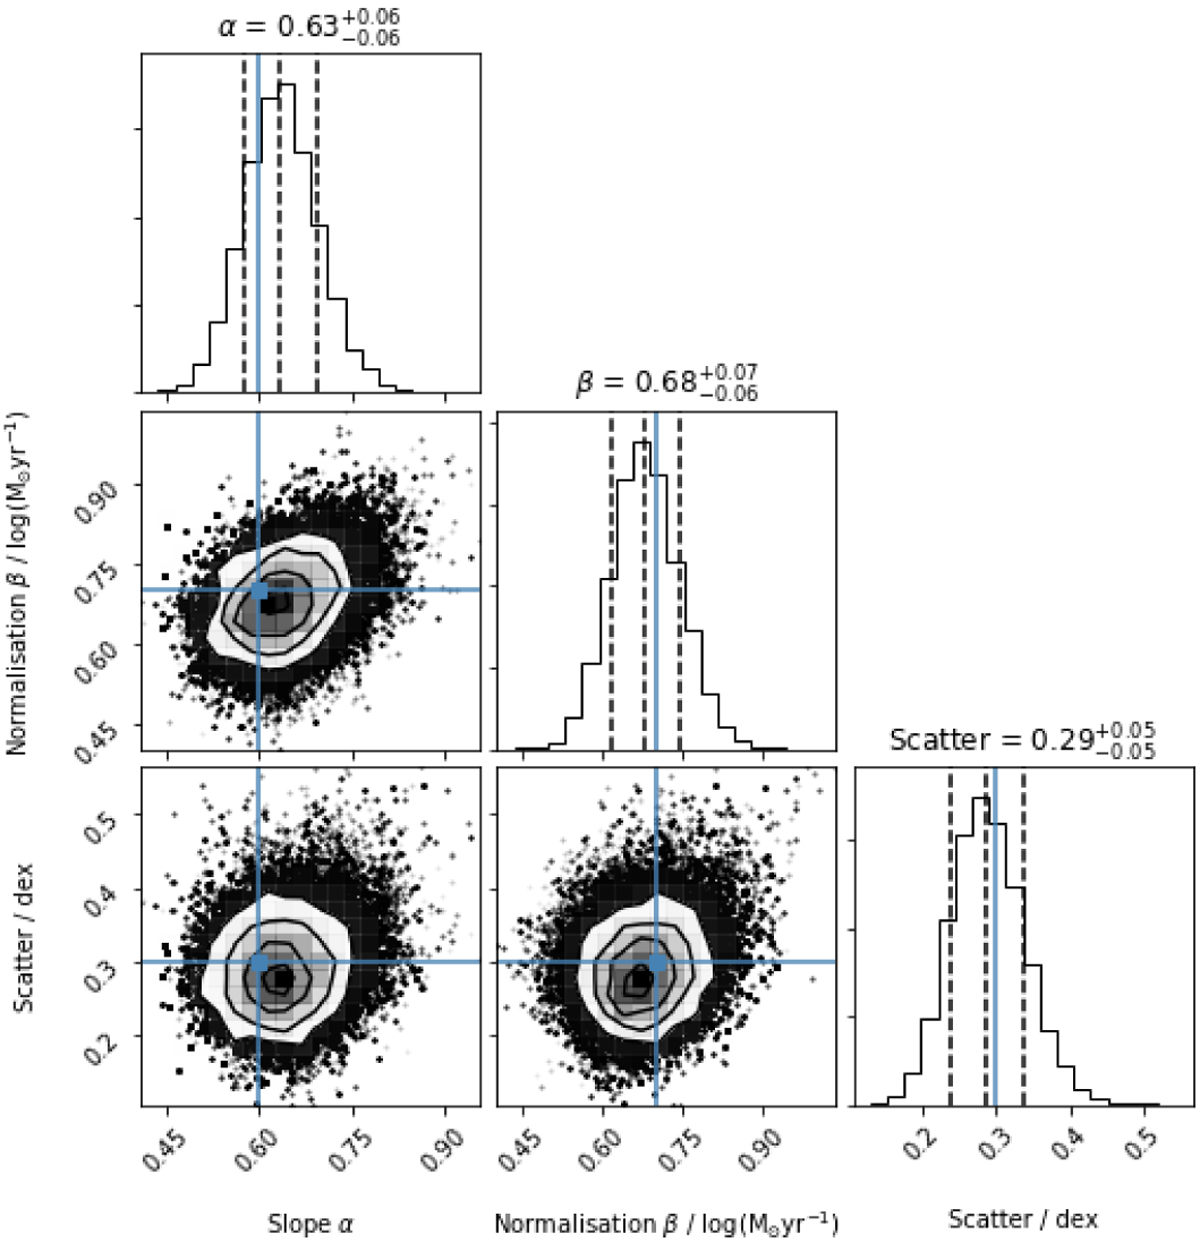
Corner plot (Foreman-Mackey 2016) of the marginalised posterior of the forward modellingroutine applied to a mock data set with known slope (0.6), normalisation (0.7 log (M⊙∕yr−1)), and scatter (0.3 dex), shown as the blue lines. Panels on the diagonal show the 1D marginalised posteriors for the slope, normalisation and scatter (left to right panels). Off-diagonal panels show the combined 2D posteriors as labelled by their axes. The recovered 16th, 50th, and 84th percentiles are shown by the dashed vertical lines; all the input parameters are recovered, within error.
Current usage metrics show cumulative count of Article Views (full-text article views including HTML views, PDF and ePub downloads, according to the available data) and Abstracts Views on Vision4Press platform.
Data correspond to usage on the plateform after 2015. The current usage metrics is available 48-96 hours after online publication and is updated daily on week days.
Initial download of the metrics may take a while.