Free Access
Fig. 4
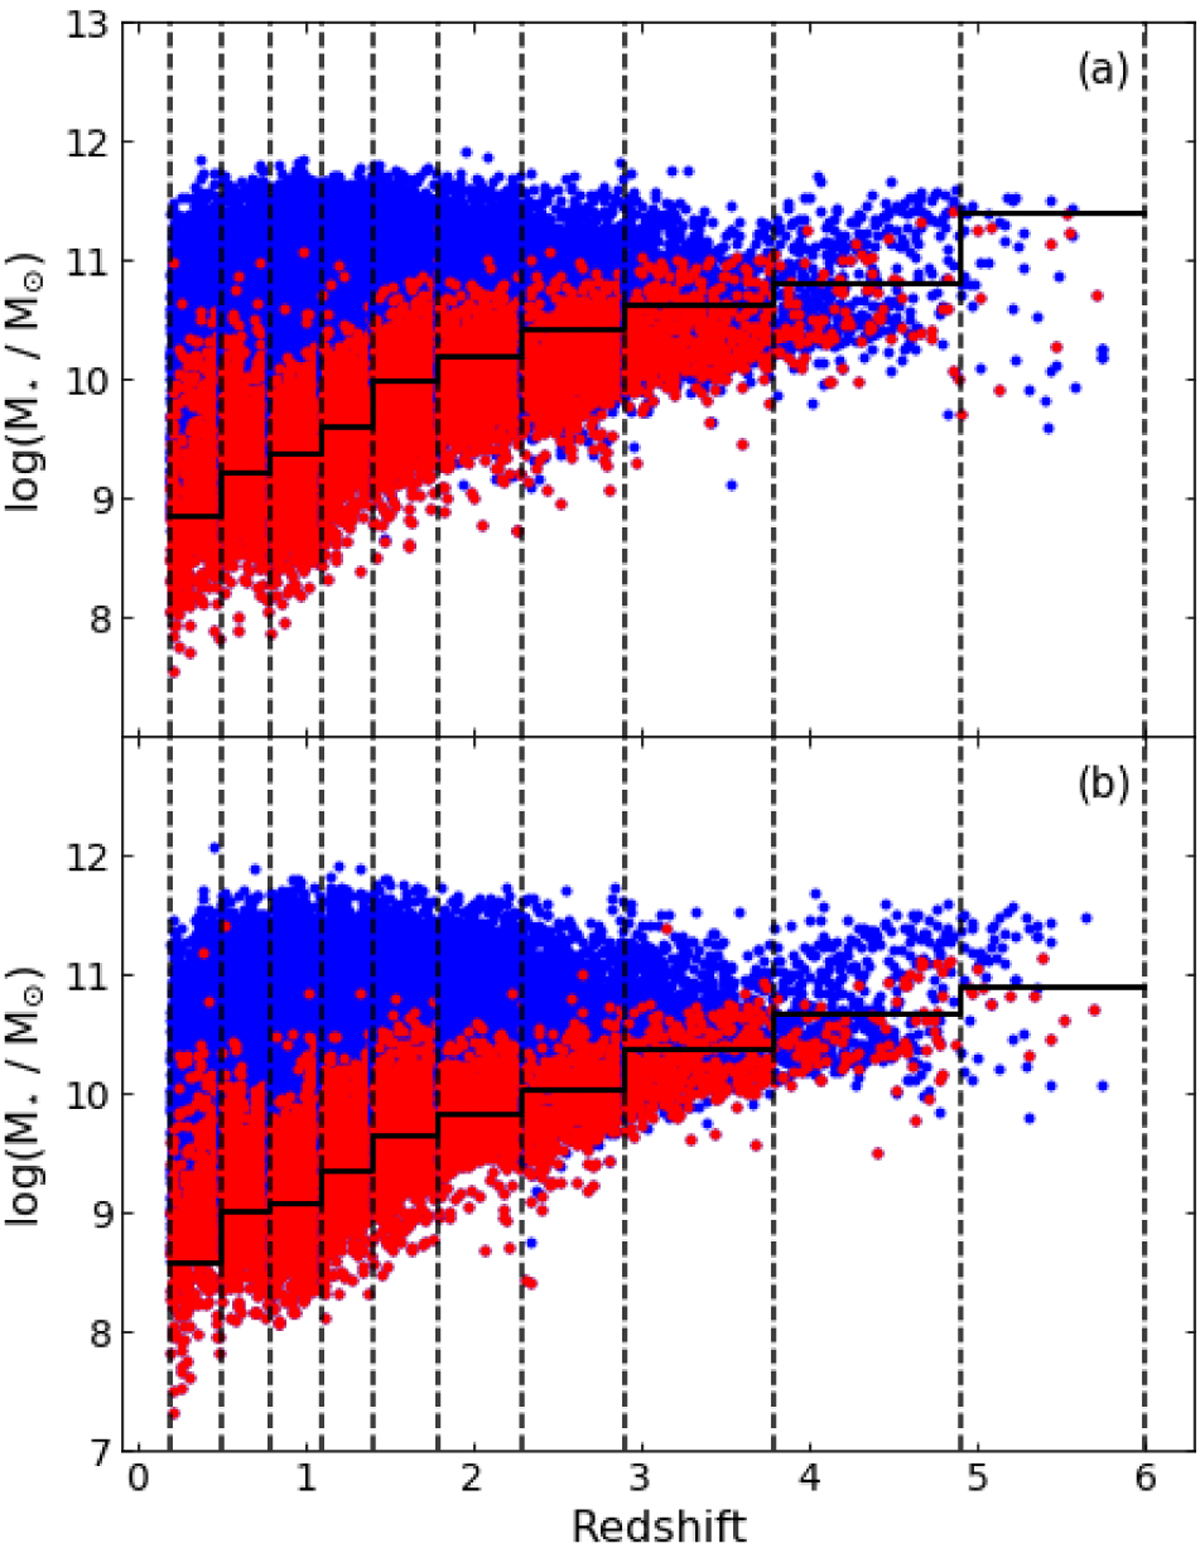
Masses of all objects detected in the Ks band (blue) are shown against redshift along with the faintest 20% in each redshift bin (red) for the (panel a) deep and (panel b) ultra-deep regions. The 90% completeness limit is shown by the thick black lines, while the dashed black lines show the edges of each redshift bin.
Current usage metrics show cumulative count of Article Views (full-text article views including HTML views, PDF and ePub downloads, according to the available data) and Abstracts Views on Vision4Press platform.
Data correspond to usage on the plateform after 2015. The current usage metrics is available 48-96 hours after online publication and is updated daily on week days.
Initial download of the metrics may take a while.