Fig. C.2
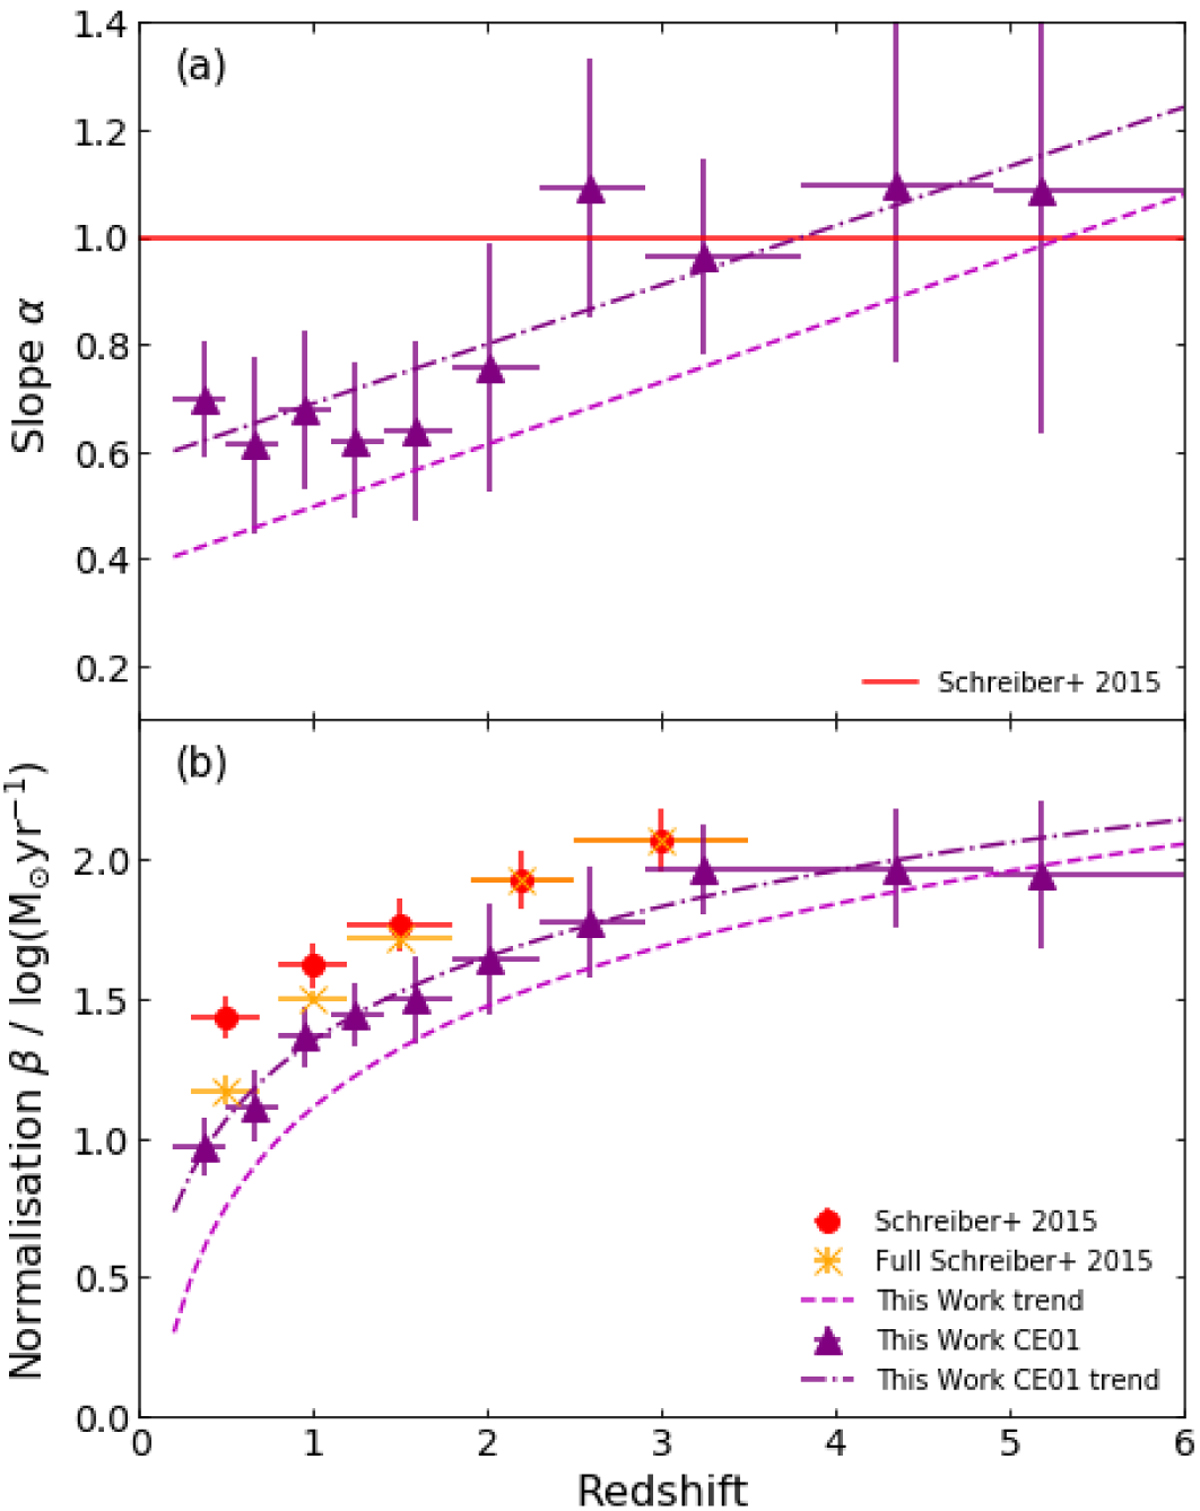
Comparison of the UVJ selected MS results of this work using the Chary & Elbaz (2001, CE01) template derived SFR (dark purple triangles) with the Schreiber et al. (2015) low-mass MS (red). The α and β parameters from Eq. (8) are in panels a and b, respectively, and the trends from Fig. 10are in magenta. As Schreiber et al. (2015) hold their low-mass slope constant at unity, this is indicated in panel a as the flat red line. The orange crosses in panel b are the normalisations for the full mass range (including turn-over) from Schreiber et al. (2015). The redshifts shown for this work are the mean redshift in each redshift bin while the horizontal error bars show the width of the redshift bin. The good agreement between the purple triangles and orange crosses and poor agreement between the purple triangles and red circles demonstrates how forcing a low-mass slope of unity results in normalisations that are too high at lower redshifts.
Current usage metrics show cumulative count of Article Views (full-text article views including HTML views, PDF and ePub downloads, according to the available data) and Abstracts Views on Vision4Press platform.
Data correspond to usage on the plateform after 2015. The current usage metrics is available 48-96 hours after online publication and is updated daily on week days.
Initial download of the metrics may take a while.