Fig. C.1
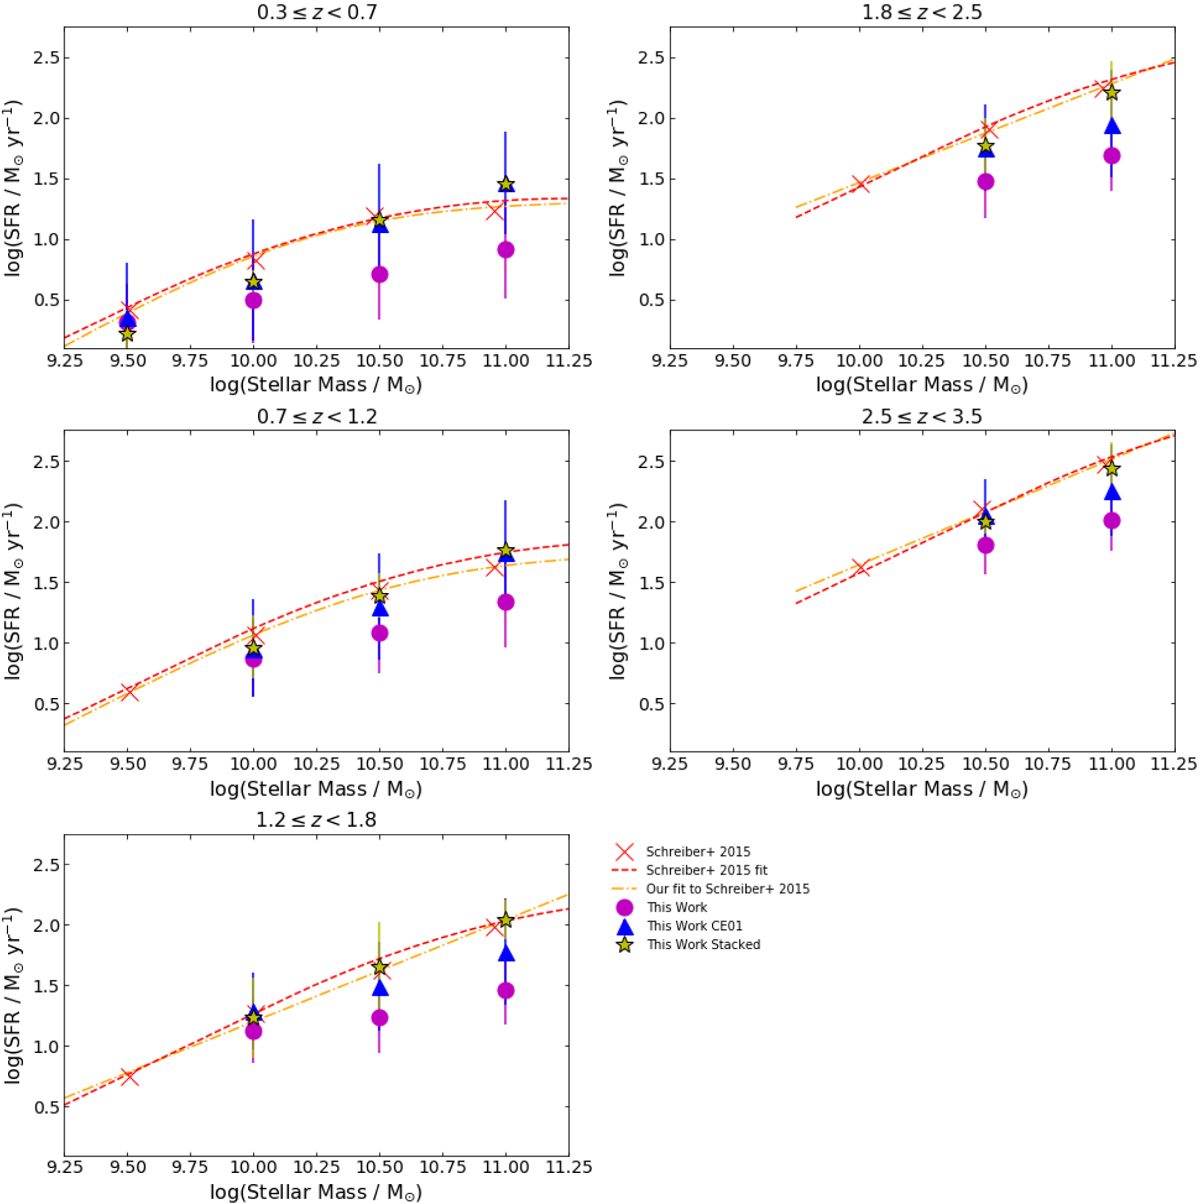
Comparisons of Schreiber et al. (2015, red crosses) SFR-M⋆ positions with redshift to different methods of deriving SFR in this work. The mean CIGALE SFR in each mass bin is in magenta, the fitting of the de-blended SPIRE data with Chary & Elbaz (2001, CE01) templates to determine the infrared luminosity (LIR) derived SFR is indicated with blue triangles, the IAS Stacking Library derived SFR with yellow stars, the full Schreiber et al. (2015) MS trends with red dashed lines, and our own fits to the Schreiber et al. (2015) data with orange dot-dashed lines. Horizontal error bars are omitted for ease of examination, but are all 0.25 dex. The Schreiber et al. (2015) data is complete to lower masses due to their use of the deeper GOODS data. As can be seen, the SFRs from SED fitting are systematically lower than those from stacking or template fitting. However, our stacked and CE01 data points are consistent with Schreiber et al. (2015) within error.
Current usage metrics show cumulative count of Article Views (full-text article views including HTML views, PDF and ePub downloads, according to the available data) and Abstracts Views on Vision4Press platform.
Data correspond to usage on the plateform after 2015. The current usage metrics is available 48-96 hours after online publication and is updated daily on week days.
Initial download of the metrics may take a while.