Fig. B.1
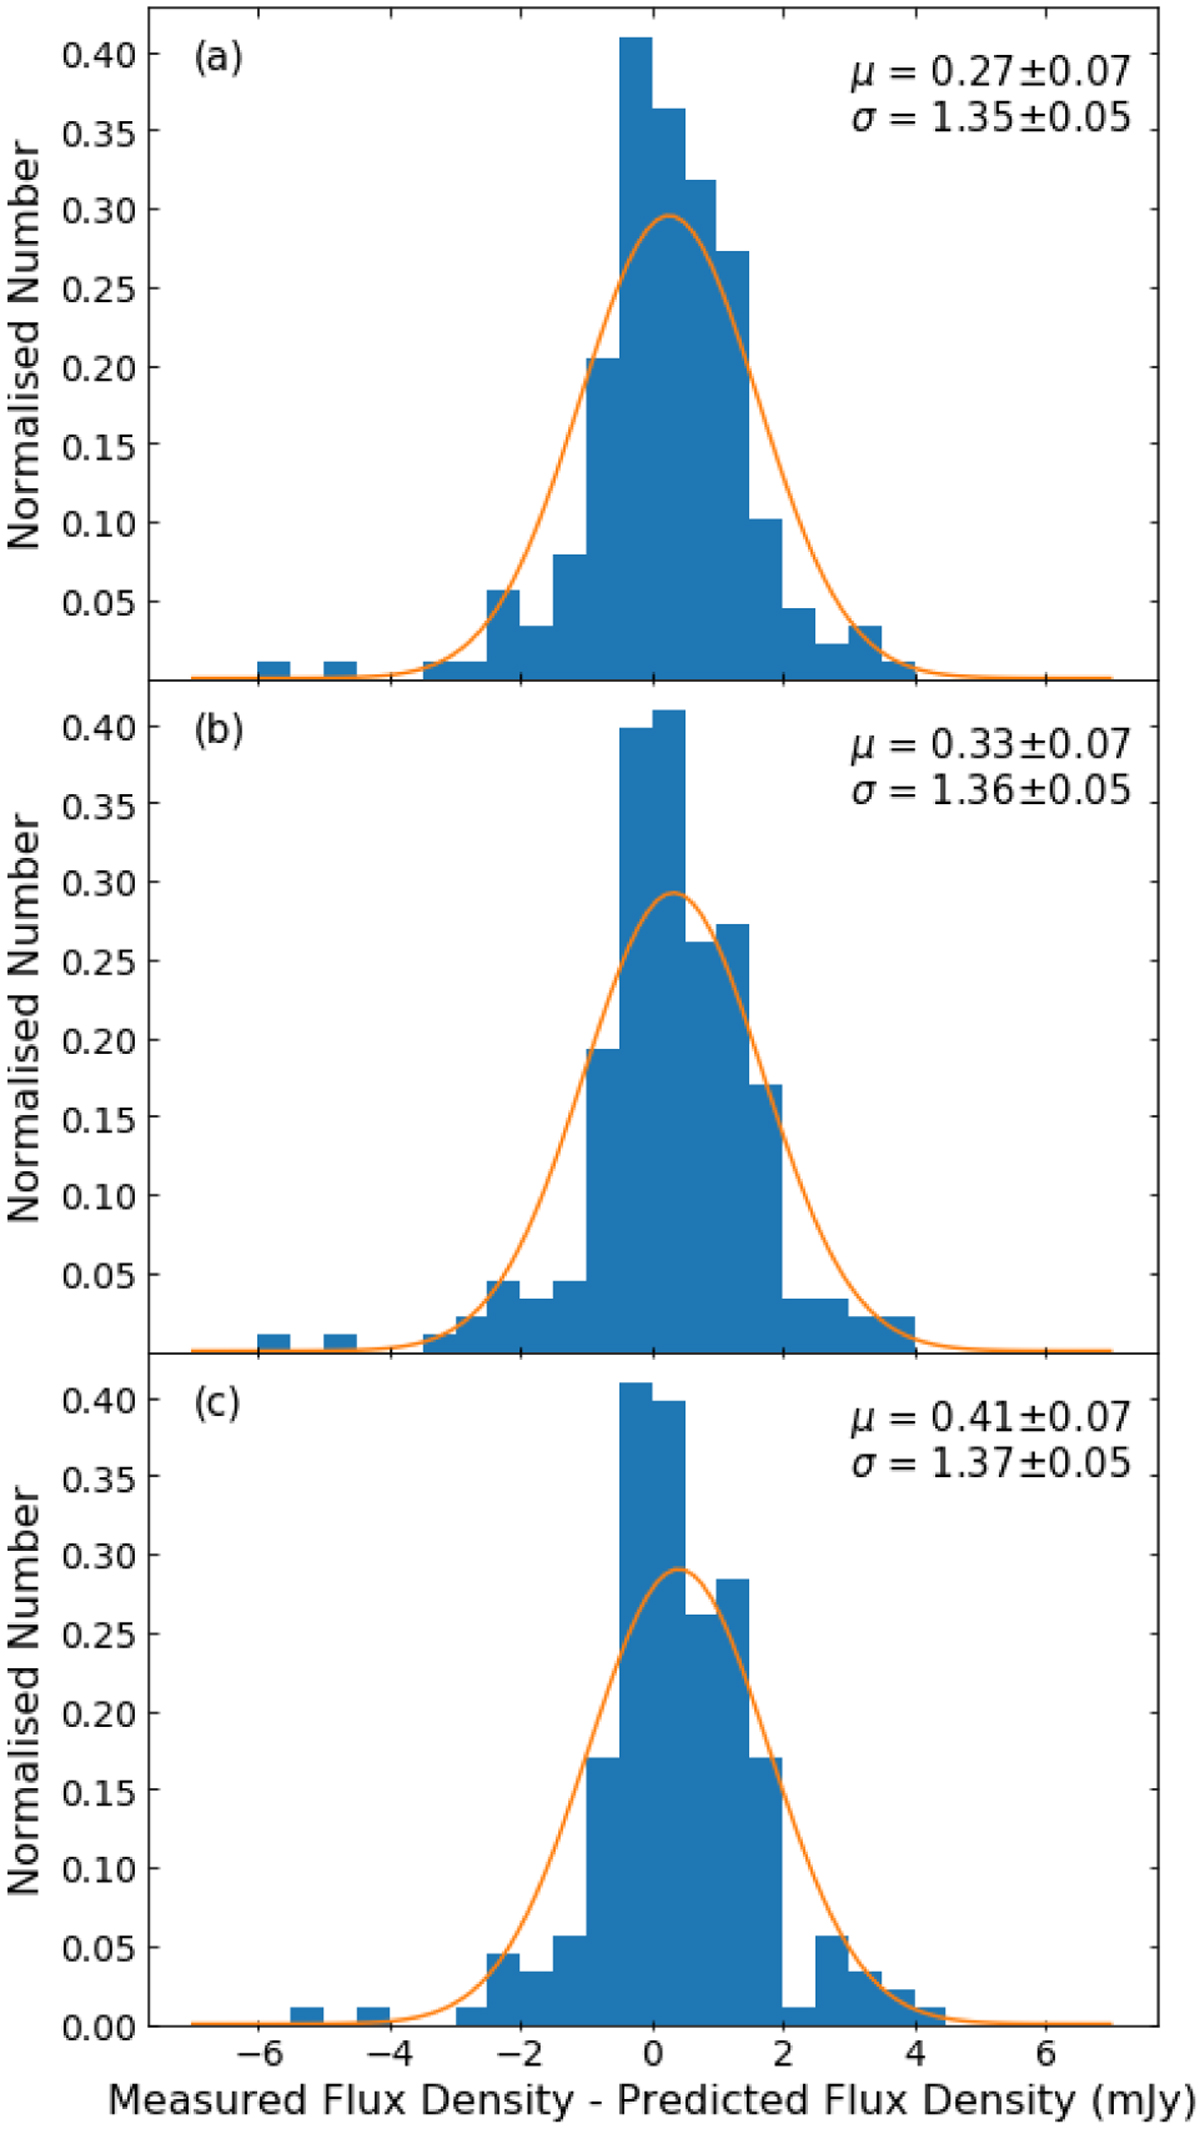
Distributions for the difference between the observed ALMA 870 μm flux densities and the predicted 870 μm flux densities from CIGALE using an error expansion factor of 2 (panel a), 3 (panel b), and 4 (panel c) in XID+. The Gaussian distribution for each expansion factor is also shown in orange, along with the means (μ) and standard deviations (σ) of the distributions. All the distributions have an approximately consistent σ so the best expansion factor was deemed to be that with μ closest to zero: 2 times the error from CIGALE.
Current usage metrics show cumulative count of Article Views (full-text article views including HTML views, PDF and ePub downloads, according to the available data) and Abstracts Views on Vision4Press platform.
Data correspond to usage on the plateform after 2015. The current usage metrics is available 48-96 hours after online publication and is updated daily on week days.
Initial download of the metrics may take a while.