Fig. 11
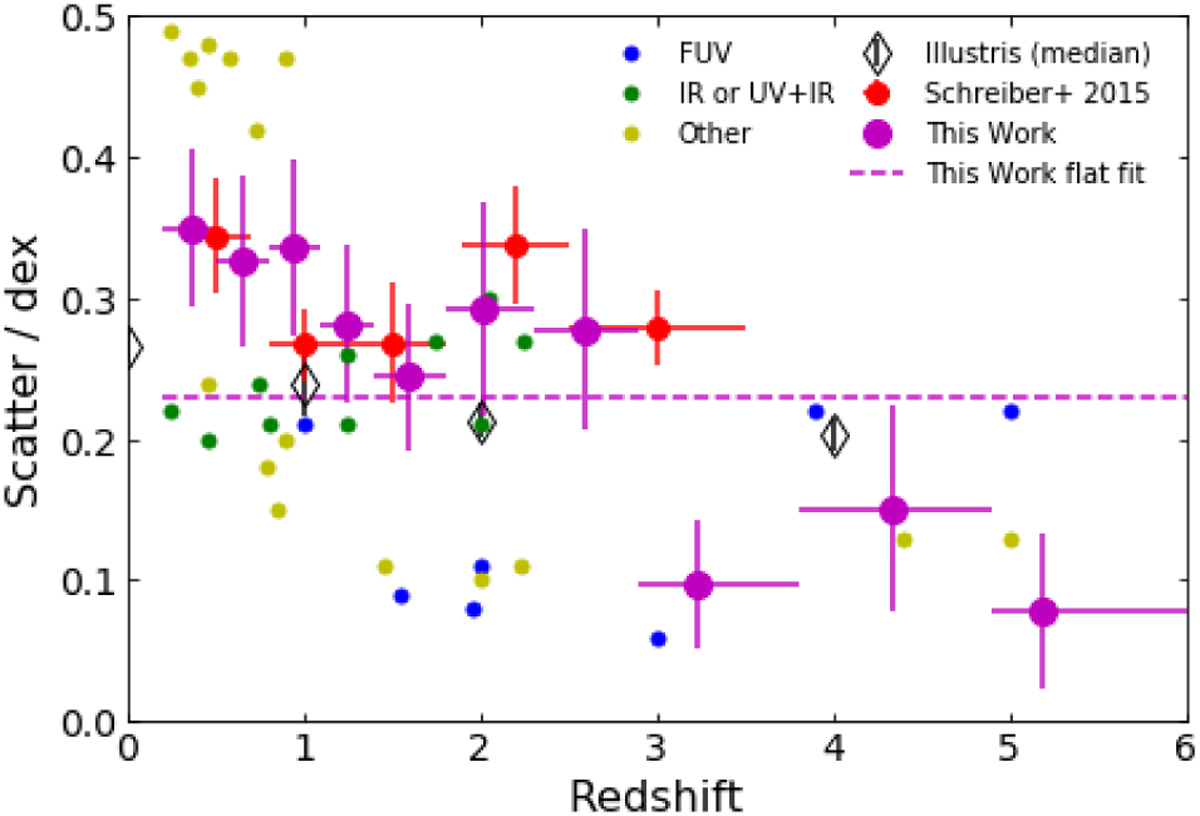
Intrinsic scatter about the MS found from the MCMC fitting of the data in each redshift bin to Eq. (8). This work (magenta) is shown along with the observed scatters from Speagle et al. (2014, FUV data in blue, IR data in green, and other data in yellow) and Schreiber et al. (2015, red) as well as the median scatter found at each redshift in the Illustris Simulation (Genel et al. 2014; Vogelsberger et al. 2014; Sparre et al. 2015, black diamonds). The redshifts shown for this work are the mean redshift in each redshift bin while the horizontal error bars show the width of the redshift bin. Also shown is the best fit to this work’s intrinsic scatter assuming no redshift evolution (dashed magenta line). The intrinsic scatter found in this work is consistent with existing literature, although above z ≈ 1.8 our intrinsicscatter is smaller than is found in works that use IR SFR traces.
Current usage metrics show cumulative count of Article Views (full-text article views including HTML views, PDF and ePub downloads, according to the available data) and Abstracts Views on Vision4Press platform.
Data correspond to usage on the plateform after 2015. The current usage metrics is available 48-96 hours after online publication and is updated daily on week days.
Initial download of the metrics may take a while.