Fig. 10
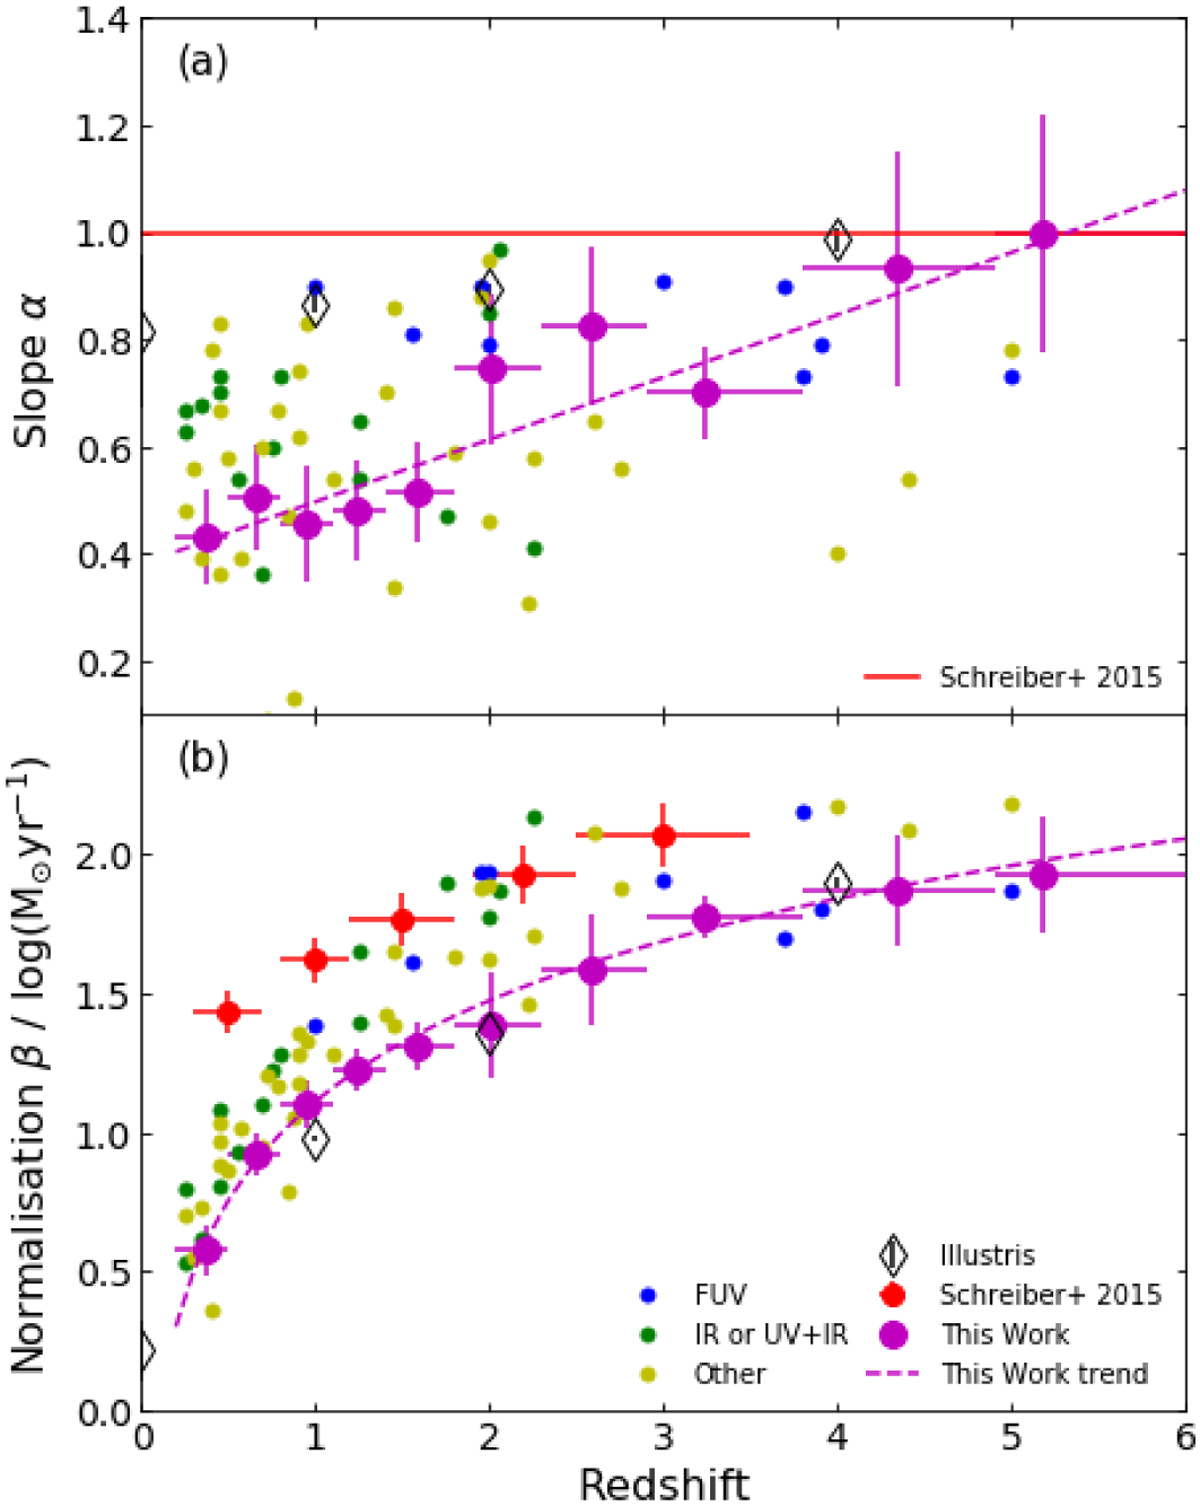
Comparison of the UVJ selected MS results of this work (magenta) with the observational MS from Speagle et al. (2014, FUV data in blue; IR data in green; and radio, hydrogen lines, and UV SED fitting in yellow), Schreiber et al. (2015) low mass MS (red), and the MS from the Illustris Simulation (Vogelsberger et al. 2014; Sparre et al. 2015, black diamonds). The α and β parameters from Eq. (8) are in panels a and b, respectively. As Schreiber et al. (2015) hold their low-mass slope constant at unity, this is indicated in panel a as a flat red line. The redshifts shown for this work are the mean redshift in each redshift bin, while the horizontal error bars show the width of the redshift bin. A version of this plot using SFRs derived from IR template fitting can be found in Appendix C.
Current usage metrics show cumulative count of Article Views (full-text article views including HTML views, PDF and ePub downloads, according to the available data) and Abstracts Views on Vision4Press platform.
Data correspond to usage on the plateform after 2015. The current usage metrics is available 48-96 hours after online publication and is updated daily on week days.
Initial download of the metrics may take a while.