Fig. 7
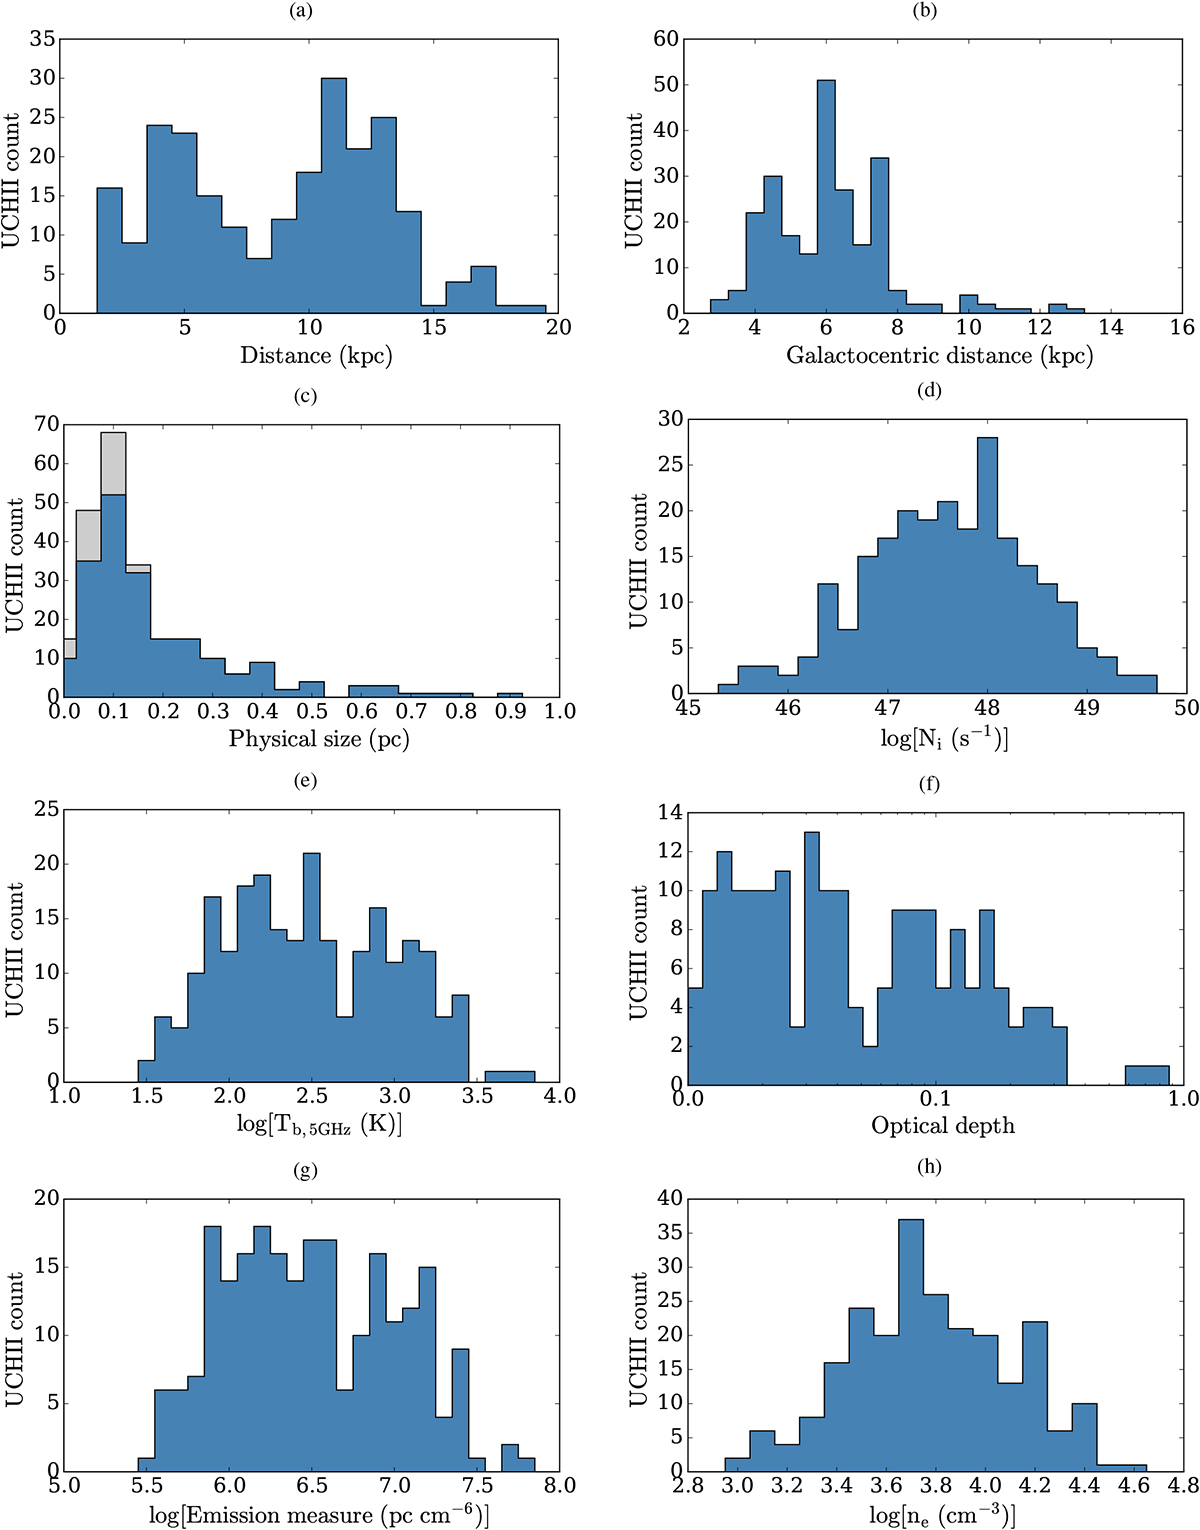
Parameter distributions of the CORNISH UCHIIs. The distance histogram (panel a) includes values from Urquhart et al. (2012, 2013), as well as the distances computed in this work. The grey area in panel c shows upper limits for sizes of unresolved sources. The Lyman continuum flux histogram (panel d) includes results from Urquhart et al. (2013), as well as results from this work, with ±10% associated error. There are ±30% errors on theemission measures (panel g) and ±20% errors on the electron densities (panel h).
Current usage metrics show cumulative count of Article Views (full-text article views including HTML views, PDF and ePub downloads, according to the available data) and Abstracts Views on Vision4Press platform.
Data correspond to usage on the plateform after 2015. The current usage metrics is available 48-96 hours after online publication and is updated daily on week days.
Initial download of the metrics may take a while.