Fig. A.1
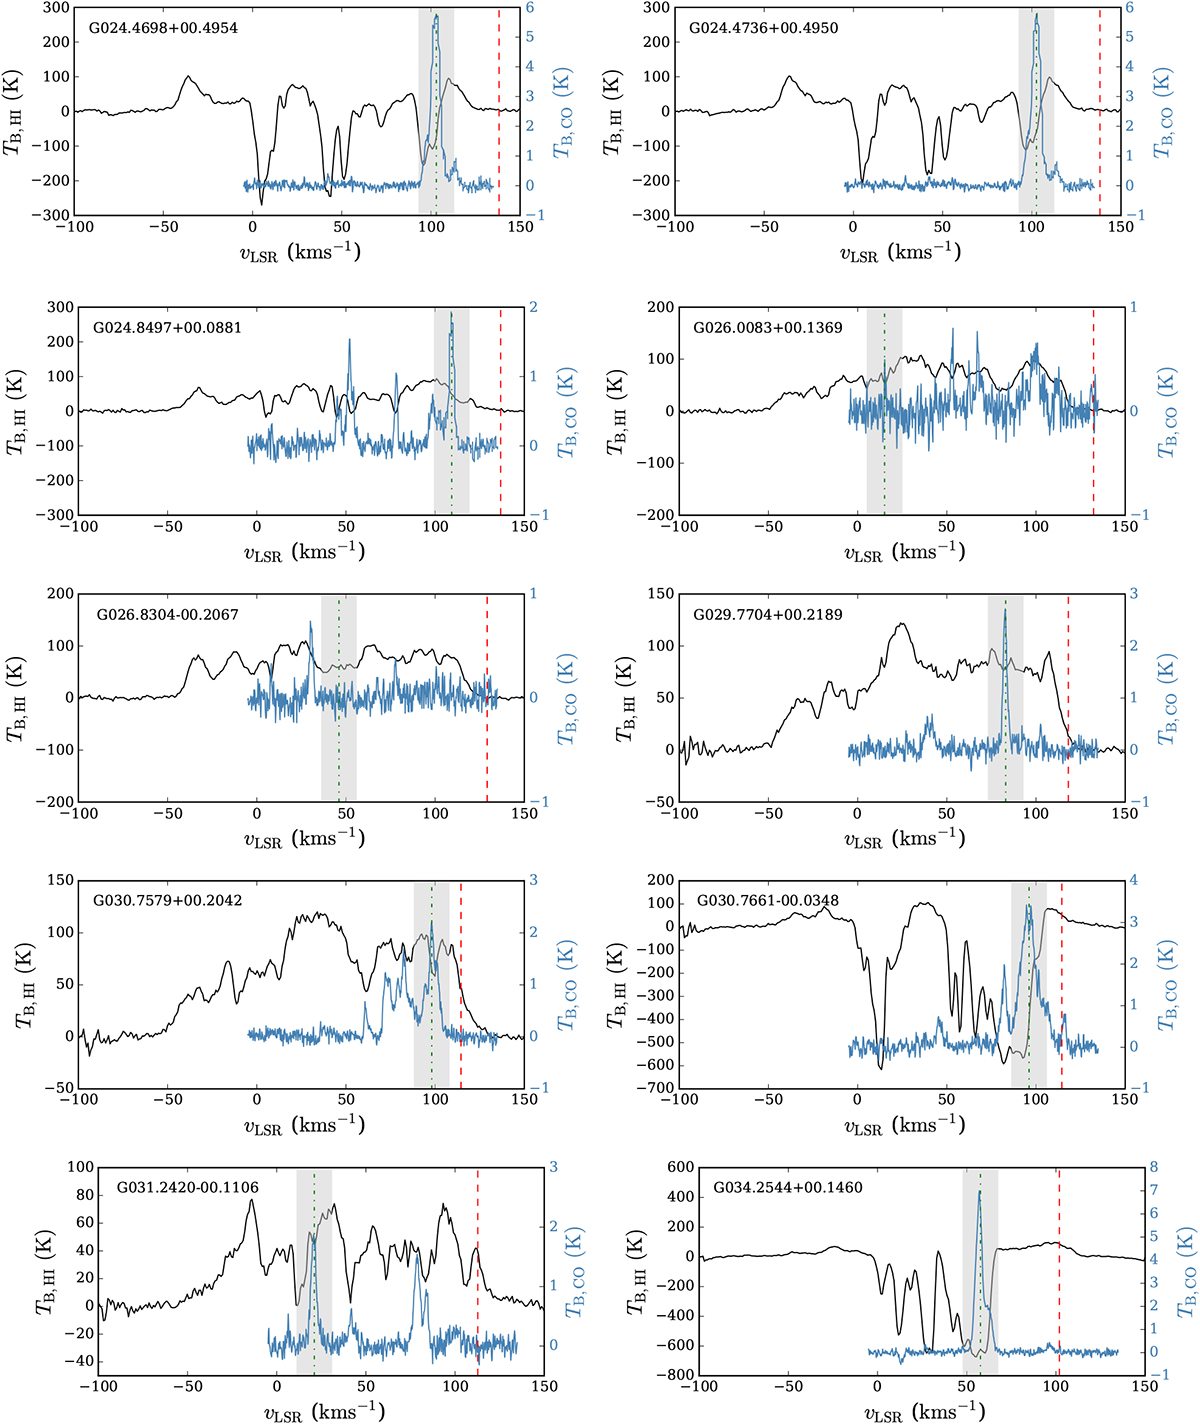
Continuum-subtracted VGPS spectra (black line) towards sources from the CORNISH UCHII region sample were used to solve their KDA. The red dashed line indicates the tangent point velocity. The blue spectrum shows the measured CO spectrum, with its corresponding y-axis also in blue. The green dot-dashed line represents the CO source velocity, with the region marked in grey on each side showing the expected uncertainty of ±10 km s−1 due to streaming motions. The H I spectrum of G024.4721+00.4877 is practically identical to G024.4698+00.4954 (top row, left) and therefore was omitted.
Current usage metrics show cumulative count of Article Views (full-text article views including HTML views, PDF and ePub downloads, according to the available data) and Abstracts Views on Vision4Press platform.
Data correspond to usage on the plateform after 2015. The current usage metrics is available 48-96 hours after online publication and is updated daily on week days.
Initial download of the metrics may take a while.