Fig. 11
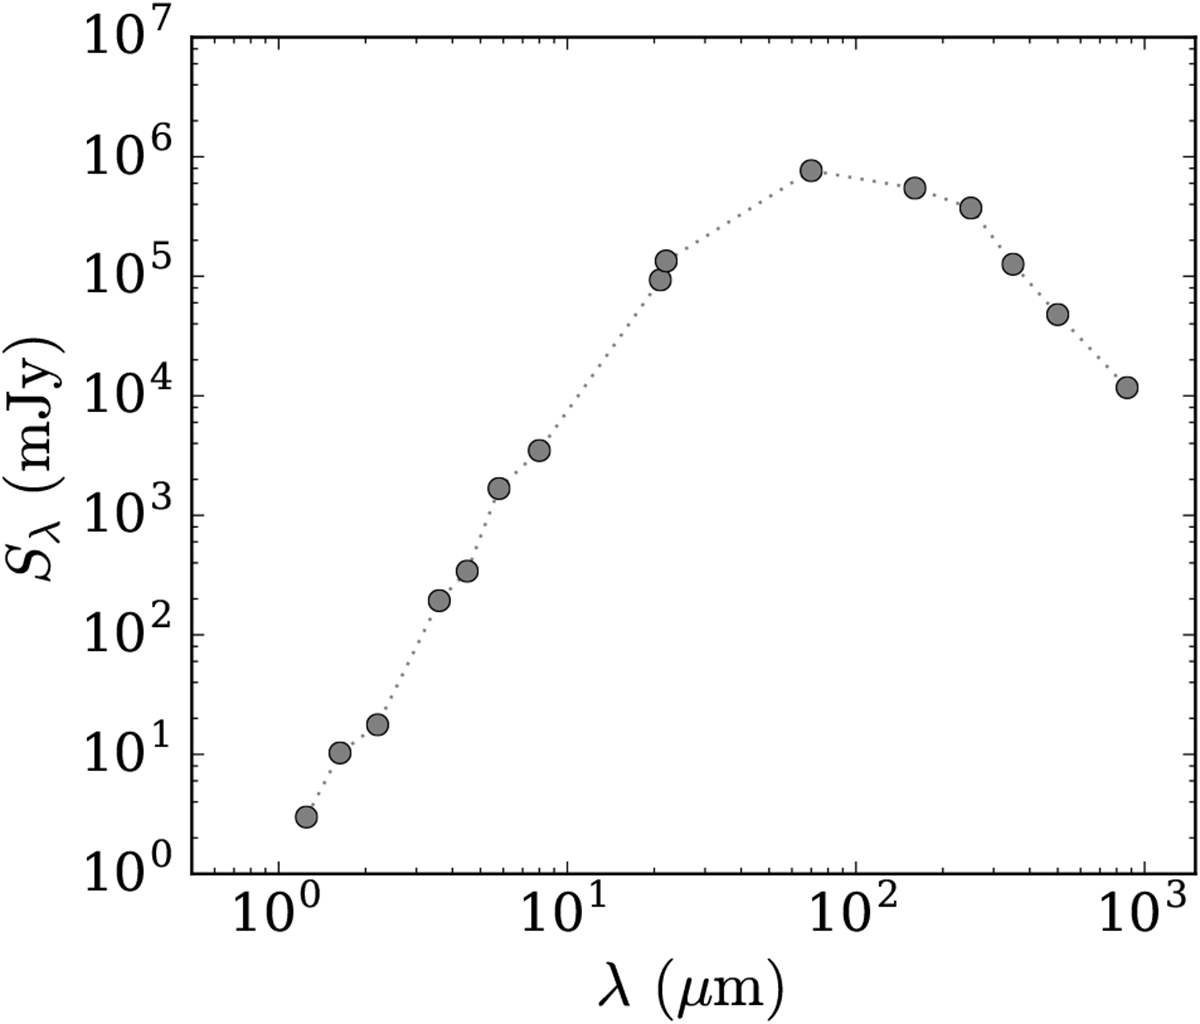
Average SED for all UCHIIs with available multi-wavelength data, normalised to the sample median distance of 9.8 kpc. The plot includes the J, H, and K UKIDSS fluxes and the 3.6, 4.5, 5.8, and 8.0 μm GLIMPSE fluxes from this work, together with fluxes from MSX (21 μm), WISE (22 μm), HiGAL (70, 160, 250, 350, and 500 μm), and ATLASGAL (870 μm; see Table A.1 in Cesaroni et al. 2015).
Current usage metrics show cumulative count of Article Views (full-text article views including HTML views, PDF and ePub downloads, according to the available data) and Abstracts Views on Vision4Press platform.
Data correspond to usage on the plateform after 2015. The current usage metrics is available 48-96 hours after online publication and is updated daily on week days.
Initial download of the metrics may take a while.