Fig. 2
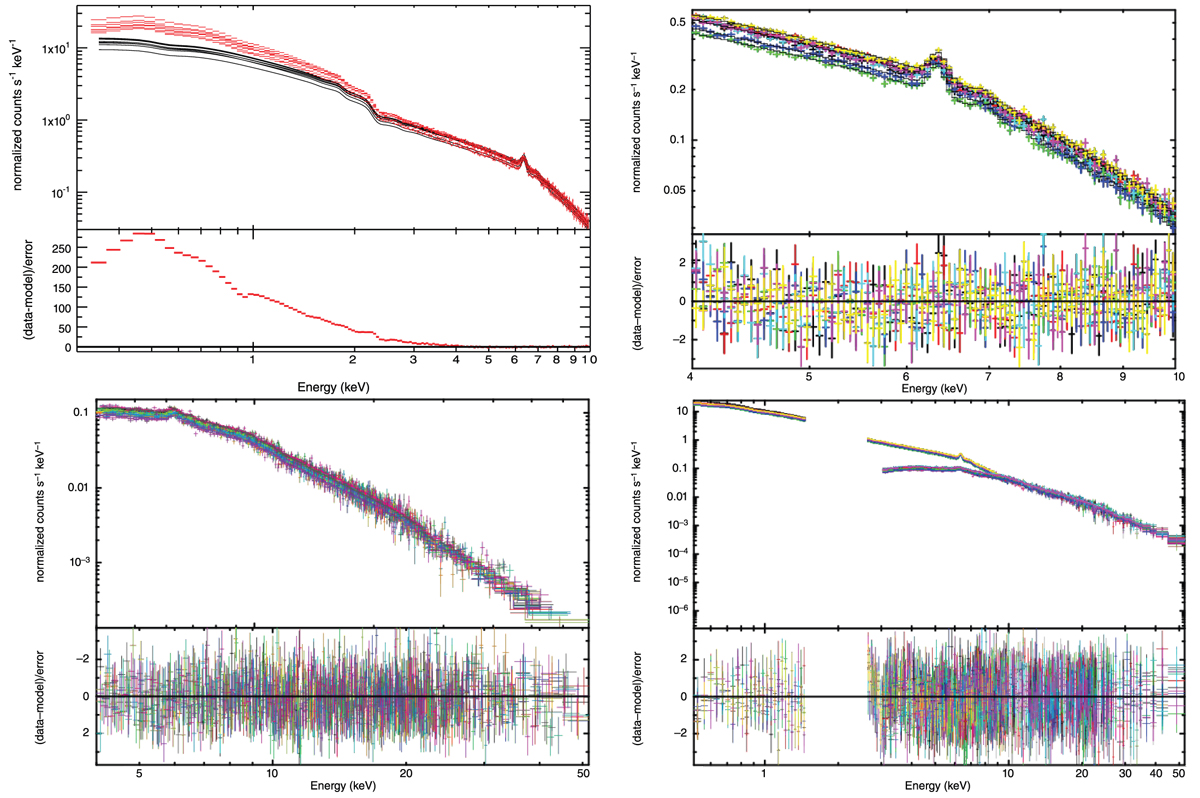
Top left panel: seven XMM-Newton spectra shown in red; the best-fit model to the data above 4 keV shown in black. Bottom panel: the residuals of the seven spectra that are grouped using in Xspec the command ‘setplot group’. A secondary component clearly extends up to 4 keV. Top right panel: best fit to the seven XMM-Newton data and corresponding residuals shown with the basic model (i.e. zashift×(pexrav+zgauss+zgauss)), to which we added other Gaussian lines when weaker emission lines were found in the observation. Bottom left panel: best fit for all NuSTAR spectra above 4 keV is shown; top subpanel shows the bestfit obtained adopting the model that employs xillver (see Sect. 4.2), while the bottom subpanel refers to the corresponding residuals. In the last panel, the best fit (χ2 = 3041 for 2765 d.o.f.) for the NGC 7469 XMM-Newton and NuSTAR spectra; see Sect. 5 for the model details.
Current usage metrics show cumulative count of Article Views (full-text article views including HTML views, PDF and ePub downloads, according to the available data) and Abstracts Views on Vision4Press platform.
Data correspond to usage on the plateform after 2015. The current usage metrics is available 48-96 hours after online publication and is updated daily on week days.
Initial download of the metrics may take a while.