Fig. 8
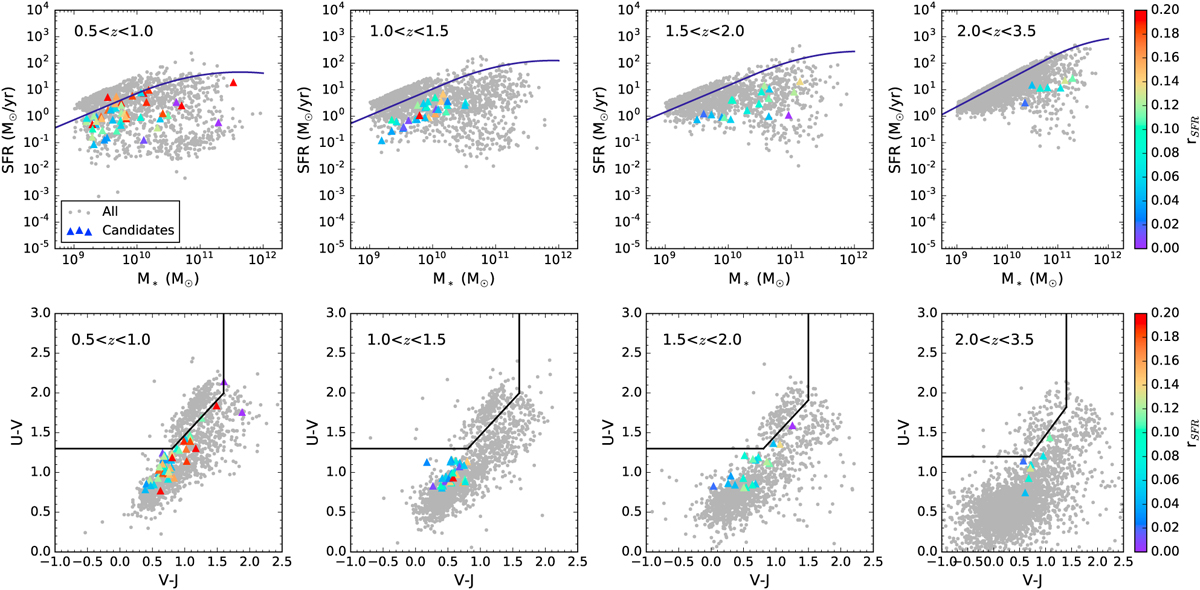
Toppanels: fitted galaxies placed on the MS diagram. The four panels show the MS in four redshift bins. Gray dots show the location of galaxies with good fits obtained with both SFH models and the pink triangles show the location of the galaxies selected as candidates for a possible recent drop of their star formation activity. Blue solid lines indicate the position of the MS at the mean redshift of the bin (Schreiber et al. 2015). Bottom panels: galaxies displayed on the UVJ diagram. Gray dots are the galaxies of the sample well fitted by both SFH models. Colored dots are the sources selected, color-coded according to the rSFR parameter. The black solid lines indicate the UVJ selection according to Whitaker et al. (2011).
Current usage metrics show cumulative count of Article Views (full-text article views including HTML views, PDF and ePub downloads, according to the available data) and Abstracts Views on Vision4Press platform.
Data correspond to usage on the plateform after 2015. The current usage metrics is available 48-96 hours after online publication and is updated daily on week days.
Initial download of the metrics may take a while.