Open Access
Fig. 7
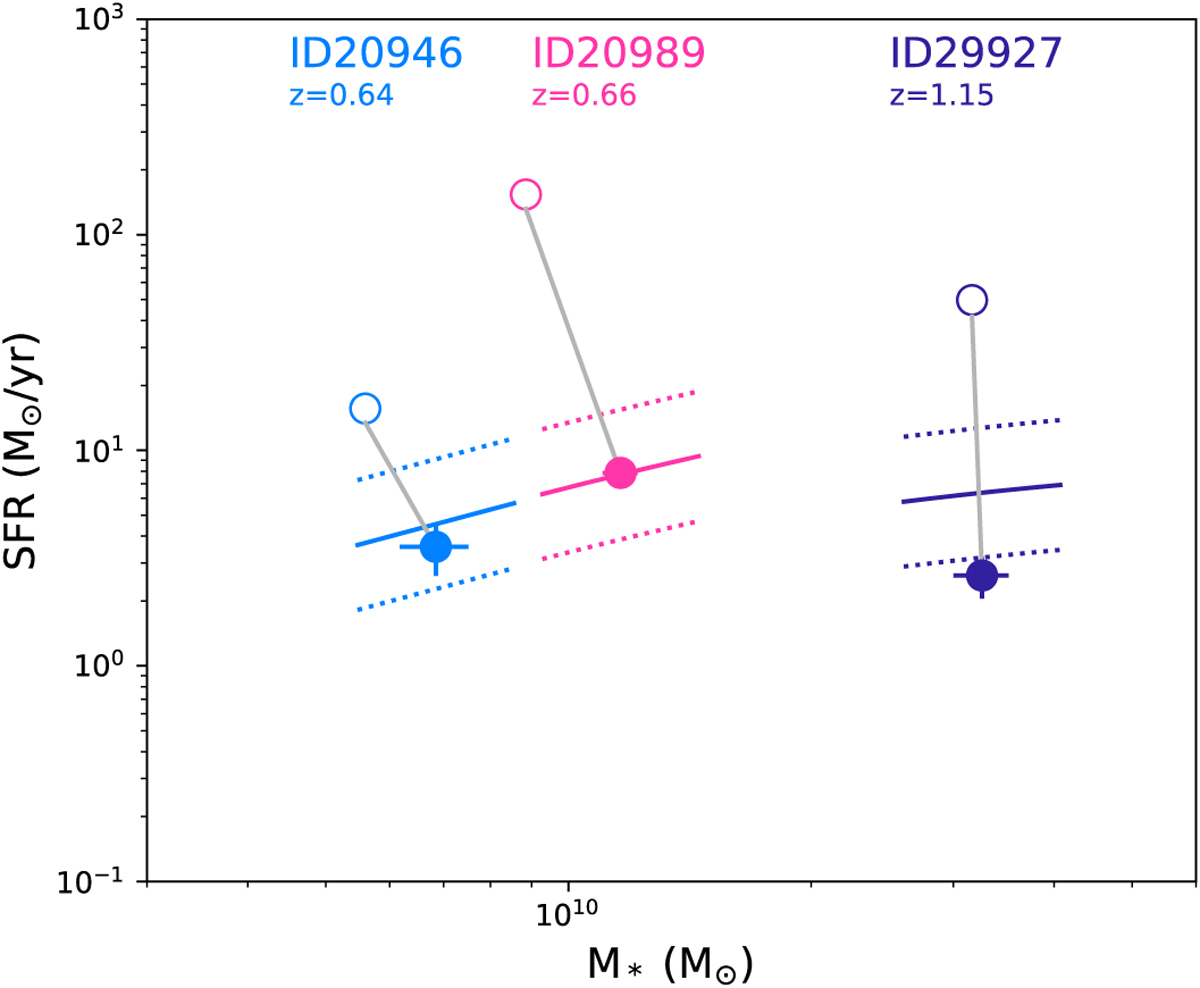
Positions of the three test candidates relative to the MS after (filled circles) and before (empty circles) the drastic decrease of star formation activity. The MS and its dispersion is indicated at the redshift of each candidate with a solid and dashed lines, respectively.
Current usage metrics show cumulative count of Article Views (full-text article views including HTML views, PDF and ePub downloads, according to the available data) and Abstracts Views on Vision4Press platform.
Data correspond to usage on the plateform after 2015. The current usage metrics is available 48-96 hours after online publication and is updated daily on week days.
Initial download of the metrics may take a while.