Fig. 13
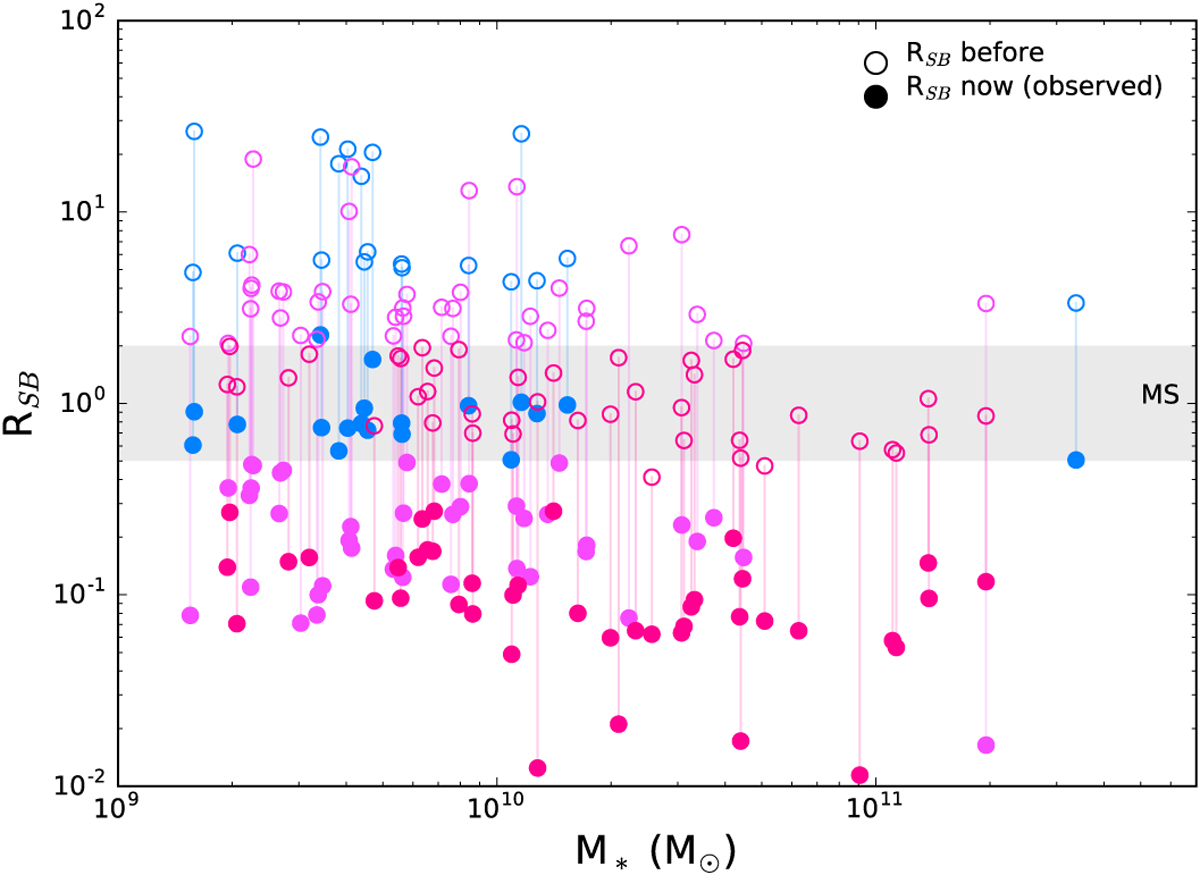
Starburstiness of the candidates before and after the strong decrease of their star formation activity as a function of their stellar mass. Filled circles indicate the position of the candidate at the moment they are observed, and the empty circles show the position of the candidates prior to the SF decrease. Colors indicate different movements: from the starburst region to the MS (blue), from above to below the MS (purple), and from the MS to below the MS (red). The gray regionsshow the MS and its scatter.
Current usage metrics show cumulative count of Article Views (full-text article views including HTML views, PDF and ePub downloads, according to the available data) and Abstracts Views on Vision4Press platform.
Data correspond to usage on the plateform after 2015. The current usage metrics is available 48-96 hours after online publication and is updated daily on week days.
Initial download of the metrics may take a while.