Open Access
Fig. 10
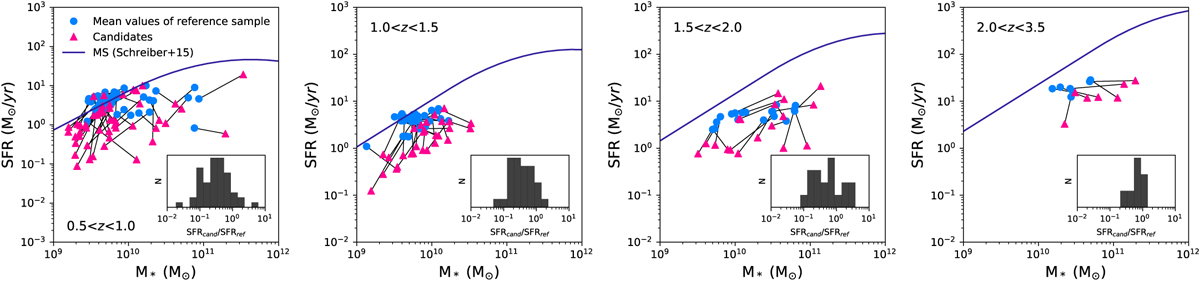
Comparison between the positions of the candidate sources (red triangles) and the mean values of their reference sample (blue circles) in the SFR–Mass diagram. The inset panels show the distribution of the ratio between the SFR of the candidate galaxies and their respective sample SFR.
Current usage metrics show cumulative count of Article Views (full-text article views including HTML views, PDF and ePub downloads, according to the available data) and Abstracts Views on Vision4Press platform.
Data correspond to usage on the plateform after 2015. The current usage metrics is available 48-96 hours after online publication and is updated daily on week days.
Initial download of the metrics may take a while.