Fig. 1
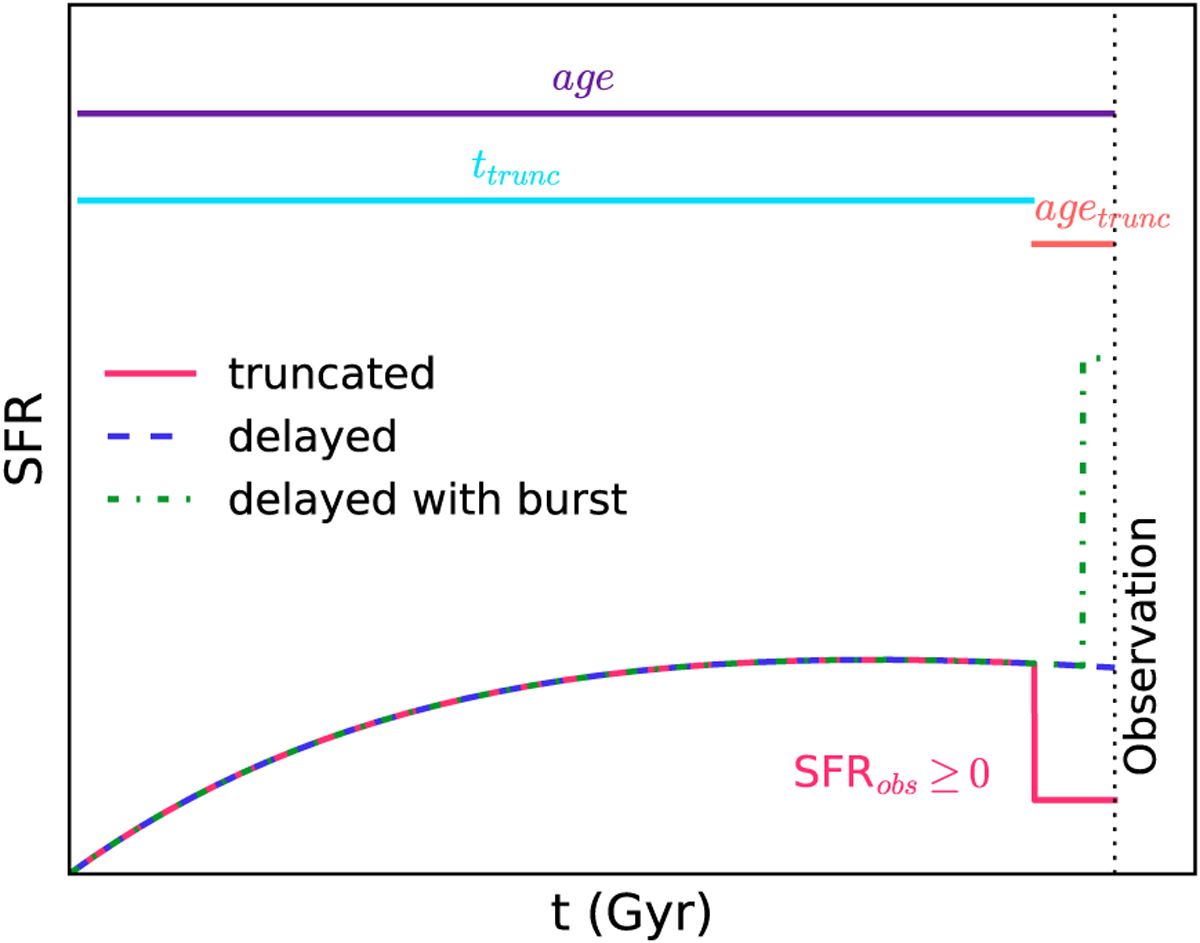
Illustration of the SFH implemented in CIGALE. The purple dashed line represents a normal delayed-τ SFH with τmain = 10 Gyr, without truncation or burst. The red solid line is the SFH showing a truncation modeling a rapid star-formation downfall and the green dashed-dotted line is a delayed-τ SFH on top of which we add a star formation burst.
Current usage metrics show cumulative count of Article Views (full-text article views including HTML views, PDF and ePub downloads, according to the available data) and Abstracts Views on Vision4Press platform.
Data correspond to usage on the plateform after 2015. The current usage metrics is available 48-96 hours after online publication and is updated daily on week days.
Initial download of the metrics may take a while.