Fig. 8
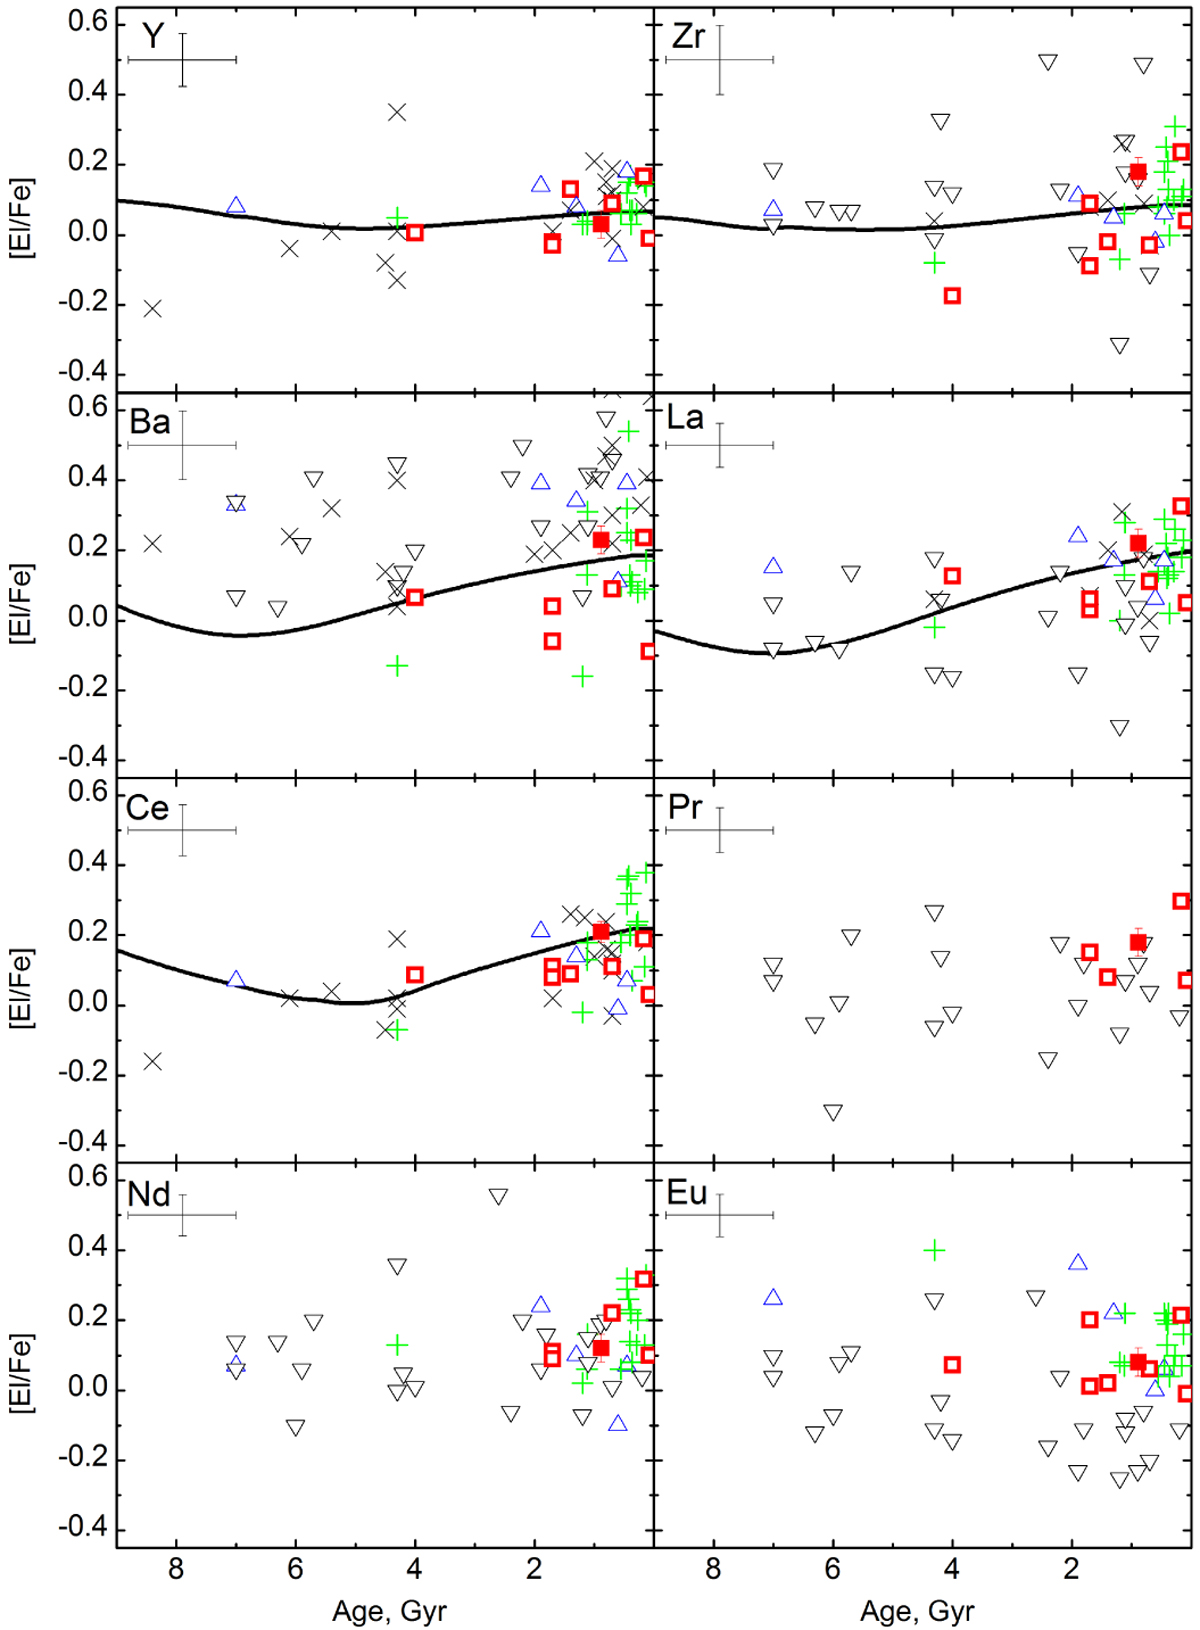
Averaged values of neutron-capture element abundances vs. age in IC 4756 (red filled squares) and other previously investigatedclusters. The green plus signs indicate results by Reddy et al. (2012, 2013, 2015); the blue triangles – results by Mishenina et al. (2015); the black crosses – results by D’Orazi et al. (2009) and Maiorca et al. (2011); the black reverse triangles – results by Jacobson & Friel (2013) and Overbeek et al. (2016); the empty red squares – results from our previous studies by Tautvaišienė et al. (2000, 2005), Mikolaitis et al. (2010, 2011a,b) and Drazdauskas et al. (2016a). The adopted approximate age errors of 0.9 Gyr are based on determinations by (Salaris et al. 2004). The continuous lines indicate a chemical evolution model by Maiorca et al. (2012) at the Solar radius.
Current usage metrics show cumulative count of Article Views (full-text article views including HTML views, PDF and ePub downloads, according to the available data) and Abstracts Views on Vision4Press platform.
Data correspond to usage on the plateform after 2015. The current usage metrics is available 48-96 hours after online publication and is updated daily on week days.
Initial download of the metrics may take a while.