Fig. 6
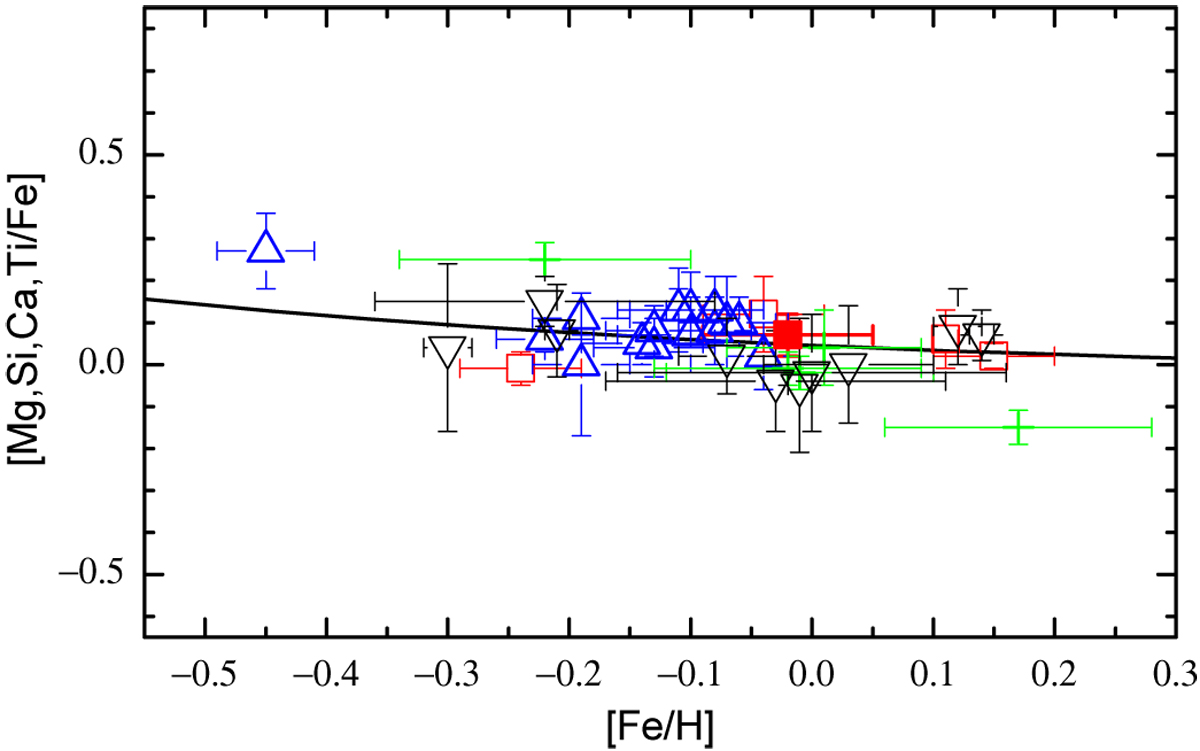
Mean α-element abundances in open cluster RGB stars. The result for this study is indicated by the red circle. Results from Tautvaišienė et al. (2005); Mikolaitis et al. (2010, 2011a,b); Drazdauskas et al. (2016b) are marked as the red open squares. The blue triangles indicate results from Reddy et al. (2012, 2013, 2015); the green plus signs from Mishenina et al. (2015); and the black reverse triangles from Friel et al. (2010); Jacobson et al. (2008, 2009). The black line represents the Galactic disc evolution model by Pagel & Tautvaisiene (1995).
Current usage metrics show cumulative count of Article Views (full-text article views including HTML views, PDF and ePub downloads, according to the available data) and Abstracts Views on Vision4Press platform.
Data correspond to usage on the plateform after 2015. The current usage metrics is available 48-96 hours after online publication and is updated daily on week days.
Initial download of the metrics may take a while.